Oren Eini

CEO of RavenDB

a NoSQL Open Source Document Database

Get in touch with me:

oren@ravendb.net +972 52-548-6969

Posts: 7,565
|
Comments: 51,184
Privacy Policy · Terms
filter by tags archive
time to read 3 min | 449 words

A user reported a bug to our support. When running on MacOS, they were unable to authenticate against a remote RavenDB instance.

That was strange, since we support running on MacOS, both as a client and as a server. We have had some issues around different behavior, but it is working, so what could the issue be?

RavenDB uses X509 certificates for authentication. That ensure mutual authentication for client and server, as well as secure the communication from any prying eyes. But on that particular system, it just did not work. RavenDB was accessible, but when attempting to access it, we weren’t able to authenticate. When using the browser, we didn’t get the “Choose the certificate” dialog either. That was really strange.  Digging deeper, we verified that the certificate was setup property in the keychain. We also tested FireFox, which has a separate store for certificates, nothing worked.

Then we tested using curl, and were able to properly access and authenticate to the server. So something was really strange here. Testing from a different machine, we were able to observe no issues.

The user mentioned that they recently moved to Catalina, which is known to have some changes in how it process certificates. None of which applied to our scenario, however.

Eventually, we started comparing network traces and then we found something really interesting. Take a look at this:

image

That was an interesting discovery. The user had an anti virus installed, and the AV installed a root CA and then setup a proxy to direct all traffic through the AV. Because it added a root CA, it was able to sniff all the traffic on the machine.

However, with a client certificate, that model doesn’t work. The proxy would need to have the private key of the certificate to be able to authenticate to the remote system, which it obviously does not have. It silently stripped the request for a client certificate, which meant that as far as RavenDB was concerned, we saw no client certificate in the request, so we rightfully rejected it.

I found it interesting that we were able to actually use curl, I assume that Avast didn’t setup the proxy so curl would be included.

The solution was simple, exclude RavenDB from the inspected addresses, which immediately fixed the problem.

I spent some time trying to figure out if there was a good way for us to detect this automatically. Sadly, there is no way to tell from the client side what is the certificate that was used. If there was, we could compare it to the expected result and alert on that.

time to read 4 min | 774 words

Jeremy Miller has an interesting blog post about using advisory locks in Postgres to handle leader elections. This is a topic I spend a lot of time on, so I went over the post in detail. I don’t like this approach, because it has several subtle issues that are going to bite you down the road. All of them are relatively obscure, and all of them are going to happen in production in short order.

Go read the blog post, it explains the reasoning well. The core of the leader election is this:

The idea is that you have a process instance, that has a State() and a Start() methods. On multiple nodes, you are running this method, and it will coordinate using Postgres to ensure that there is only a single process that owns the lock at any given point in time. At least, that is the idea. In practice, there are issues.

Let’s assume that we are protecting a shared resource, such as a printer. We want to serialize access to the printer so two print jobs won’t get their pages mixed together. For simplicity, we’ll assume just two such nodes that compete on the lock.

On startup, one of the nodes will successfully get the lock, and the other will not, resulting in retries. So far, this is as expected.

I’m ignoring for now the lack of error handling, if we cannot start the connection, the whole thing is going to fail. This is sample code, so I’m pointing this out because the code must be resilient to such issues. We may bring up a node before the database is ready, and in this case, you’ll need to retry access the data.

A much more serious problem here is that we have a way for the process to signal that it is broken, but there is no way for the service to tell the process that it is no longer the leader. Let’s assume that a network issue has caused the connection to drop. The code, as written now, has no way of identifying this issue. It is actually worse than expected, because the connection isn’t actually being used. So even if the connection has dropped, the service is not aware of this. Even this, though, is something that can be fixed in a straightforward manner. You can add a cancellation token that the process will listen to.

You also need to keep verifying against the database server that you are still the owner of the lock and that the connection didn’t drop / fail and released it behind your back. And of course, there may be a delay between losing the lock and finding out about that.

That leads us to the most serious problem: Race conditions. In this case, even if the code handled all such scenarios nicely, we have to take into account the fact that we are dealing with separate resources here. In our example, we have Postgres for the leader election and the printer as the protected resource. The two nodes are competing on the lock, and then one of them starts printing. The lock is lost because of a network reset. At this point, Postgres frees the lock and the other node is able to lock it. It starts to run its own printing jobs.

Let’s say that the first node has a way to detect that it lost the lock. There is still the issue of how fast that can happen. It is very likely that at a certain point, you’ll have two nodes that believe that they are the leader. That is a Bad Thing.

A couple of years ago, GitHub was down for more than a day because of exactly this kind of a scenario. I analyzed the issue at the time in detail.

In this case, using the system above, you are pretty much guaranteed to have a messed up printing job, with pages from multiple jobs mixed together.

If you really care about consistency in the leader operations, you can’t just run things using a leader election. You have to run everything through the same mechanism. In GitHub’s example, they used Raft (a distributed consensus algorithm), but they used that to make decisions on a separate system, so there was a guarantee for inconsistency in that system.

In other words, you are either all in to distributed consensus or you should be out. Note that being out is fine, if you don’t care about short periods of multiple leaders. But if you need to ensure that this is the case, you cannot make it work without building it properly from the ground up.

time to read 3 min | 455 words

The RavenDB Time Series webinar is now available, and as usual, I would love your feedback. This webinar had the most questions yet, including a few curve balls that I had to field midway through. It was fun.

I also gave some bad information during the webinar, and I want to apologize for that. I mentioned some benchmark results and it appear that I didn’t wait for the complete work to be done.

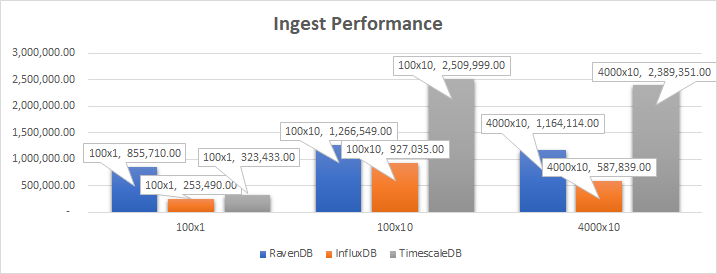
Using the time series benchmark set, RavenDB can get some really nice numbers. All the numbers were run on i3.xlarge machine:

image

The first benchmark was for a single value, across 100 different time series. RavenDB is actually faster here than the other two contenders combined. This is the most common scenario that we envisioned, and it was heavily optimized.

For the other scenarios (100 time series, with 10 measurements on each tick and 4,000 time series with 10 measurements with each tick) RavenDB does very nicely. It is significantly faster than InfluxDB, but not as fast as TimescaleDB in this scenario.

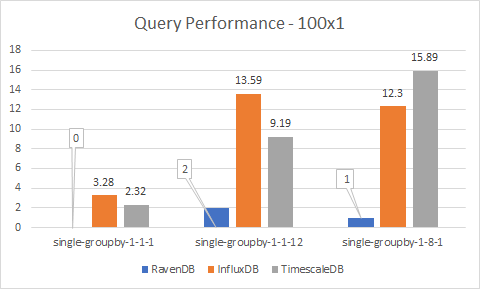
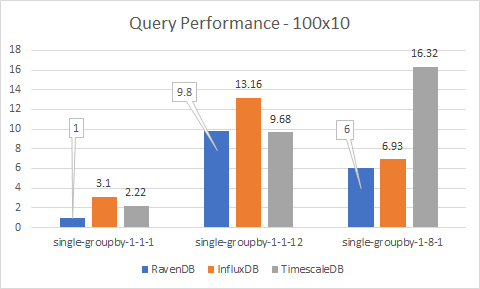
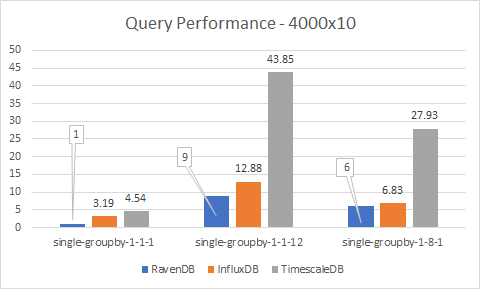
That said, when it comes to queries, we have a whole different ballgame. Here we have the following scenarios:

single-groupby-1-1-1

Simple aggregate (MAX) on one metric for 1 host, every 5 mins for 1 hour

single-groupby-1-1-12

Simple aggregate (MAX) on one metric for 1 host, every 5 mins for 12 hours

single-groupby-1-8-1

Simple aggregate (MAX) on one metric for 8 hosts, every 5 mins for 1 hour

image

Here we are running this on a small data set, with 100 time series with a single measurement. You see it properly, RavenDB is able to run this fast enough that we cannot measure the speed of the query.

image

When we have 10 measurements per time series, we put a little more effort of RavenDB, but it is still either the fastest or very nearly so.

When we increase the size of the data to 4,000 time series each with 10 measurements per tick, we see that RavenDB’s performance is effectively constant.

image

This is because RavenDB is being smart about how it runs queries and is able to do a lot of work upfront, significantly improving query time.

And this is before we gotten to the fact that you can run your indexes on time series data as well. Take a look at the webinar recording, I think you’ll be impressed.

time to read 2 min | 348 words

In RavenDB, I have just added support for document compression using zstd. That was a non trivial feature, if only because we need to also take into account document changes over time and other important aspects. You can read all about those in the post that describe the feature. This post isn’t actually about this feature, it is about how zstd got the ability to train on external data.

One of the things that I do on a project that I am interested in is read, not just the code, but also things like issue tracking, discussions etc that surround it. I find that it gives me a lot more context about the proper use of the code.

During my tour of the zstd project, I run into this issue. This is the original issue that got zstd the ability to use an external dictionary to compress known data. I wrote a blog post on the topic, because the difference in efficiency is huge. A 52 MB of JSON docs compress to 1MB if you compress all the documents together. If you compress each document independently, you’ll get 6.8 MB. With a dictionary, however, you can reduce that by 20% – 30%, and with an adaptive dictionary, you can do even better.

So I was interested in reading how this feature came about. And I was very surprised to find my own name there. To be rather more exact, in 2014, I wanted to understand compression better, so I wrote a small compression library. It isn’t a very good one, and it is mostly based around femtozip anyway, but it was useful for me to understand what was going on there. It seems that this was also useful to Christophe, over a year later, to get interested enough to add this capacity to zstd.

And the circle came around full circle this year, six years after my original research into compression, when RavenDB has a really nice documents compression feature that can be traced back to me being curious a long time ago.

time to read 3 min | 414 words

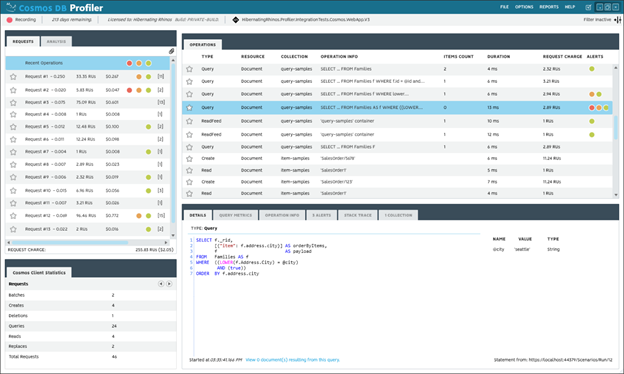
imageThe very first product of Hibernating Rhinos was a profiler for NHibernate, to allow you to figure out exactly what is going between your database and application. Now I’m proud to present our latest product: the Cosmos DB Profiler.

If you are using Azure, you are likely familiar with Cosmos DB. Cosmos DB is not a traditional relational database. It is marketed by Microsoft as a multi model database and it is widely known in the world of distributed databases. The first part is important enough to bear repeating. Cosmos DB is not a relational database, even if there is a tendency to treat it as such.

We have gathered everything we know about optimal database usage, mixed in all the experience we run into seeing users bump into issue working with distributed systems and then looked into all the best practices published about successful Cosmos DB applications. After we had all of that, we looked into patterns, things that we can do for you, automatically, that would prevent you from messing up. Thus, the Cosmos DB profiler was born.

Here is how it looks like, profiling an application locally:

image

As you can see, it give you context to the interaction between your application and the database. It allows you to see exactly what is going on behind the scenes. This is important, since most Cosmos DB applications aren’t trivial, we are usually talking about big applications with a lot of data and moving pieces. It can be hard to understand what is actually going on when you run a particular action.

Furthermore, the profiler is able to give you concrete suggestions that will improve your performance and reduce you cloud bills.

image

The pricing model for Cosmos DB is based on provisioned capacity, and it is very easy to get into a state where you need to provision a lot more than what you expected to need. The profiler is able to detect such issues, provide you with concrete recommendations on how to fix them and show you the savings, immediately.

I’m doing a webinar on the Cosmos DB profiler on Tuesday and I would love to see you there.

FUTURE POSTS

No future posts left, oh my!

RECENT SERIES

  1. Production Postmortem (52):
    07 Apr 2025 - The race condition in the interlock
  2. RavenDB (13):
    02 Apr 2025 - .NET Aspire integration
  3. RavenDB 7.1 (6):
    18 Mar 2025 - One IO Ring to rule them all
  4. RavenDB 7.0 Released (4):
    07 Mar 2025 - Moving to NLog
  5. Challenge (77):
    03 Feb 2025 - Giving file system developer ulcer
View all series

RECENT COMMENTS

Syndication

Main feed Feed Stats
Comments feed   Comments Feed Stats
}