Linq to Sql Profiler: Spike results
Well, so far, so good.
I started by defining a simple Linq to SQL model, there are zero things that you need to do here to make things work:
And now to the actual code using this model:
static void Main()
{
    LinqToSqlProfiler.Initialize();
    using (var db = new BlogModelDataContext())
    {
        var q = from blog in db.Blogs
                where blog.Title == "The Lazy Blog"
                select blog;

        foreach (var blog in q)
        {
            Console.WriteLine(blog.Title);

            foreach (var post in blog.Posts)
            {
                Console.WriteLine(post.Title);
            }
        }
    }
}
I think that we can agree that this is pretty routine usage of Linq to SQL. The only thing extra that we need is to initialize the profiler endpoint.
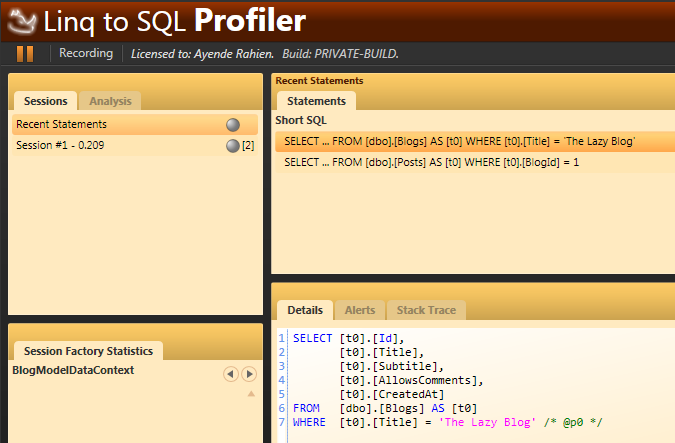
The end result is:
We can detect data contexts opening and closing, we can detect queries and their parameters, format them to display properly and show their results. We can even detect queries generated from lazy loading and the stack trace that caused each query (a hugely valuable feature).
Now, before you get too excited, this is a spike. A lot of the code is going to end up in the final bits, but there is a lot more to do yet.
Things that I am not going to be able to do:
- Track local transactions (I’ll probably be able to track distributed transactions, however)
- Show query row count
- Track query duration
- Show entities load by session
I am going to be able to show at least some statistics, however, which is pretty nice, all told.
Thoughts?


Comments
This is something that I often wish I could do with LinqPad. Very cool Oren!
The only thing that worries me is that initialize line. Does it incur penalty on production? Is there a switch to turn it off if it does (kinda like setting verbosity on logging)?
Ronald,
Yes, there is perf penalty, and you can put an if around it for production usage.
YES!!!!!!!!!!!!!!
How are you hooking all the datacontext open stuff?
Rob,
Do you see the blo's tag line? That is how.
Oh no... You changed the blog by-line. So you don't want any more patches? ;)
Sell out!!!!!! ;)
Ayende,
Recently I've spent a lot of time optimizing LINQ to SQL performance. This tool will be really handy for the devs!
Are you planning to put alerts for the:
[*] N+1 selects
[*] Possibly suboptimal queries (for example select * from 10 tables).
[*] Unclosed transactions
[*] ...
I'd be very interested in testing your bits ;)
Sergejus,
The first two, certainly.
The third is much more complicated, and likely won't be there.
This will be huge. Sql Profiler is just not good enough these days.
Nice work Ayende. This is a good example of the benefits you get from well-architected code -- the fact that this was so easy to implement, because you're not tightly coupled to any particular ORM.
And now you can get rich selling NH Prof to millions of L2S users :)
Good to see L2S being given some love. It deserves it.
ok I'm too excited to read article (or comments) so I just quickly spit my question out...
is it real? will it be avaiable for Entity Framework v4? man you're killing me :D
well I see the x-profiler post now... man, haven't been here for a while and the "world is changing so fast".. :)
and how "peaceful and quiet", I mean relaxing, my world was without the need to hit Oren's blog this night if there's anything new, hehe
your rhino logo looks a bit weird next to the "Linq to SQL" tag ... i've to get used to that after associating the rhino with alt net for a long time, maybe you change that to a softer, "rhino light" ;) ... however great to see that you get some business going on after volunteering for so long
cowgaR,
Yes, it is for real, and I intend to target the 3.5 versions first.
@Ayende : this is as tasty as a bun covered in aweseomsauce!
I can't wait to get my hands on this :) I hope it's not a pre-April fools joke ... +1 for giving L2S some love :)
I don't get it.
If you're using someone else's linq to sql dlls (or your own custom ones) the inject extensibility points, then your first bit about there being 0 you need to do to make it work isn't true as you'd need to change the reference to be to your dll.
Unless you unregister from the gac and add yours or something.
mmhhh is not Linq to SQL dead or something?
Rob,
I am not making ANY changes to he linq to sql binaries, they are running as they always did.
I am hooking up to them externally.
Ivo,
It is a good first test.
Do you mind sharing how then? I'm guessing by your terse replies that you probably don't want to say, maybe for competitive reasons or something.
I'm just curious because it seems like a useful thing to be able to do.
Rob,
It is complex and not really interesting.
I thought Linq to SQl was not being supported by MS anymore?
Has this changed?
Dirk,
It is supported for the next 10 years
Comment preview