Investigating query performance issue in RavenDB
We got a query perf issue from a user. Given a large set of documents, we run the following queries:
Query time: 1 – 2 ms
And:
Query time: 60 – 90 ms
Looking into the details, I run the following query:
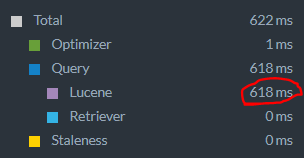
Which gives us the following details (I was running this particular result under a profiler, which is why we get this result):
That was strange, so I decided to look deeper and look into a profiler. I run five queries, and then look into where the costs are:
This is really strange. What is going on there?
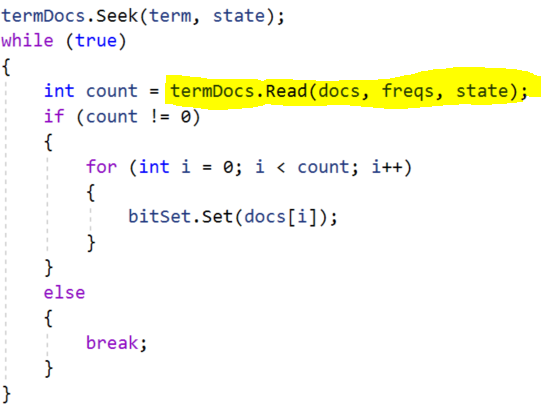
Looking into the reasons, it seems that the core of the issue is here:
What is going on here? The rough it is that we have: For each term inside the IN, find all documents and set the relevant bit in the bit set.
We have roughly 100,000 documents that match the query, so we have to do 100,000 index entry lookups. But how does this work when using an OR? It is much faster, but I really couldn’t see how that could be, to be frank.
Here is the profiler output of running the OR query, note that we call the same thing, SegmentTermDocs.Read as well here. In fact, the IN clause has been specifically optimized in order to make such things extremely efficient, what is going on here?
The key here is in the number of calls that we have. Note that in the OR case, we call it only 16 times? This is because of a very interesting dynamic very deep inside Lucene.
The query we have return no results. This is because there is no “customers/100” in the data set. That, in turn, means that the OR query that match between the two clauses need to do a lazy scan. There are no results, so the OR needs to only access evaluate very little of the potential space we have there. On the other hand, the way we implemented the IN clause, we select all the matches upfront, but then they are all filtered out by the query.
In other words, the OR query is lazy, and the IN is eager, which cause the difference. When we have data for the query, we see much closer behavior. The OR query is still about 20ms faster, but now that we understand what is going on, this is something that can be fixed.


Comments
Comment preview