Oren Eini

CEO of RavenDB

a NoSQL Open Source Document Database

Get in touch with me:

oren@ravendb.net +972 52-548-6969

Posts: 7,582
|
Comments: 51,212
Privacy Policy · Terms
filter by tags archive
time to read 1 min | 142 words

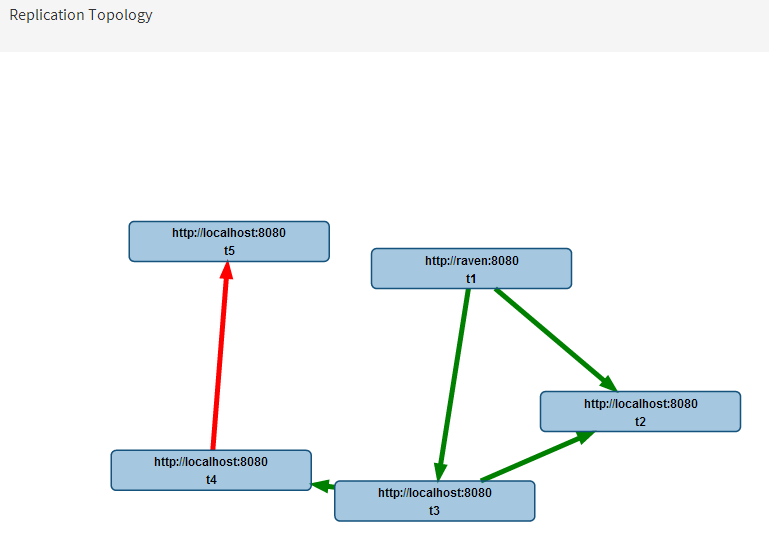
Even more goodies are coming in RavenDB 3.0. Below you can see how to visualize the replication topology in a RavenDB Cluster. You can also see that the t5 database is down (marked as red).

image

This is important, since this gives us the ability to check the status of the topology from the point of view of the actual nodes. So a node might be up for one server, but not for the other, and this will show up here.

Beside, it is a cool graphic that you can use in your system documentation and it is much easier to explain Smile.

time to read 2 min | 262 words

A customer asks in the mailing list:

Due to data protection requirements, we have to store a users data closest to where they signed up. For example if I sign up and I’m in London, my data should be stored in the EU.

Given this, how do we ensure when replicating (we will have level 4 redundancy eventually), that any data originally written to a node within say the EU does not get replicated to a node in the states?

The answer here is to use to features of RavenDB together. Sharding and Replication. It is a good thing that they are orthogonal and can work together seamlessly.

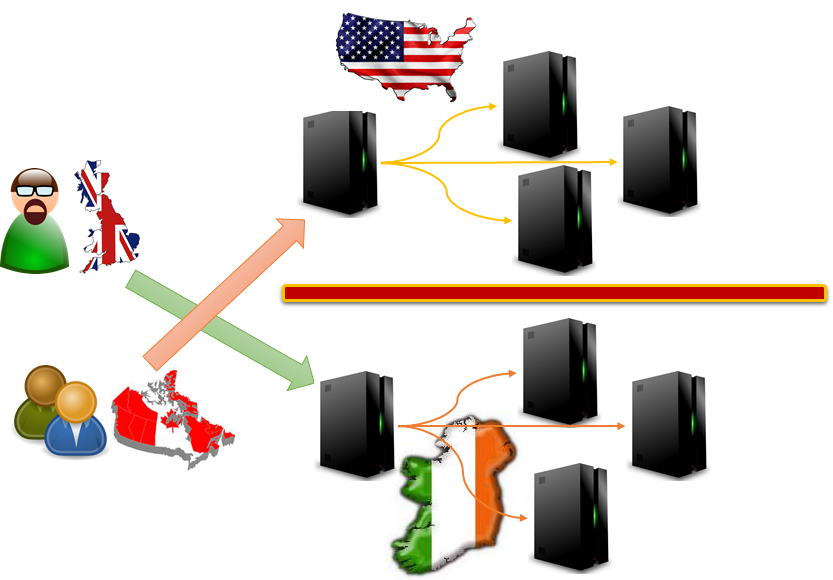
Here is how it looks like:

image

The London based user will be sharded to the Ireland server. This server will be replicating to other Ireland based server (or to other servers in the EU). The data never leaves the EU (satisfying the data protection rules), but we get the high availability that we desire.

At the same time, Canadian customers will be served from a nearby states based servers, and they, too, will be replicating to nearby servers.

From a deployment standpoint, what we need to do is the following:

  • Setup a geo distributed sharded cluster using the user’s location.
  • Each shard would be a separate server, which is replicating to N other servers in the nearby geographical area.

And that is pretty much it…

time to read 4 min | 685 words

We got a customer question about a map/reduce index that produced the wrong results. The problem was a problem between the conceptual model and the actual model of how Map/Reduce actually works.

Let us take the following silly example. We want to find all the animal owner’s that have more than a single animal. We define an index like so:

// map
from a in docs.Animals
select new { a.Owner, Names = new[]{a.Name} }

// reduce
from r in results
group r by r.Owner into g
where g.Sum(x=>x.Names.Length) > 1
select new { Owner = g.Key, Names = g.SelectMany(x=>x.Names) }

And here is our input:

{ "Owner": "users/1", "Name": "Arava" }    // animals/1
{ "Owner": "users/1", "Name": "Oscar" }    // animals/2
{ "Owner": "users/1", "Name": "Phoebe" }   // animals/3

What would be the output of this index?

At first glance, you might guess that it would be:

{ "Owner": "users/1", "Names": ["Arava", "Oscar", "Phoebe" ] }

But you would be wrong. The actual output of this index… It is nothing. This index actually have no output.

But why?

To answer that, let us ask the following question. What would be the output for the following input?

{ "Owner": "users/1", "Name": "Arava" } // animals/1

That would be nothing, because it would be filtered by the where in the reduce clause. This is the underlying reasoning why this index has no output.

If we feed it the input one document at a time, it has no output. It is only if we give it all the data upfront that it has any output. But that isn’t how Map/Reduce works with RavenDB. Map/Reduce is incremental and recursive. Which means that we can (and do) run it on individual documents or blocks of documents independently. In order to ensure that, we actually always run the reduce function on the output of each individual document’s map result.

That, in turn, means that the index above has no output.

To write this index properly, I would have to do this:

// map
from a in docs.Animals
select new { a.Owner, Names = new[]{a.Name}, Count = 1 }

// reduce
from r in results
group r by r.Owner into g
select new { Owner = g.Key, Names = g.SelectMany(x=>x.Names), Count = g.Sum(x=>x.Count) }

And do the filter of Count > 1 in the query itself.

time to read 2 min | 277 words

Yes, I talked about this already, but we made some additional improvements that make it even cooler.

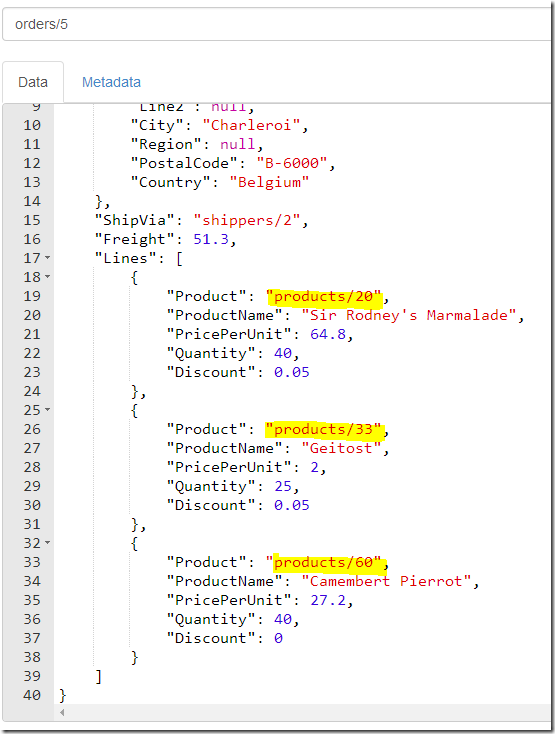
Here is a document:

image

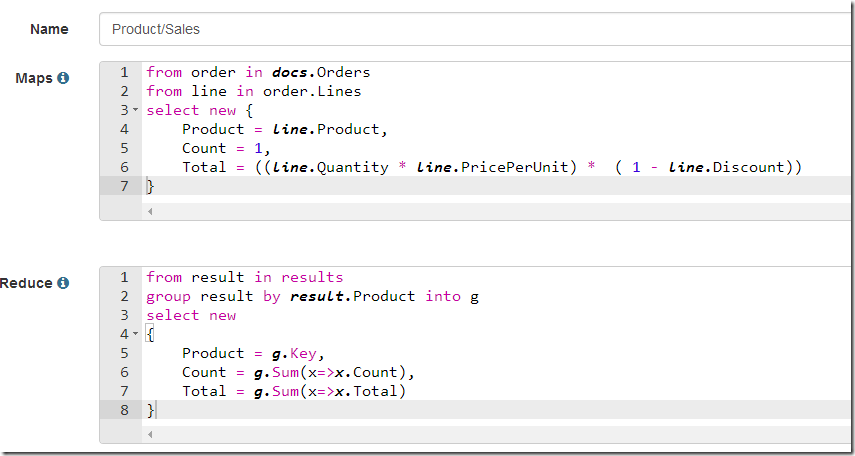
And here is the index:

image

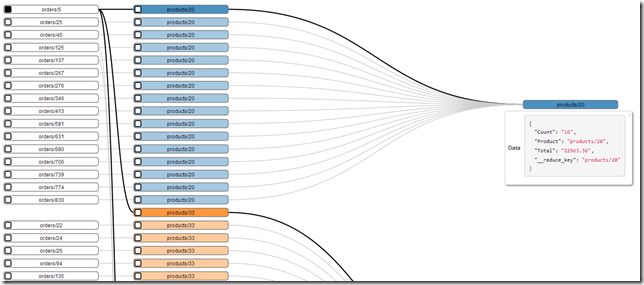
Now, let us look at what happens when we go to the map/reduce visualizer:

image

This is a highly zoomed out picture, let us zoom a little (click it for higher zoom):

image

As you can see, we can see all the documents that have any reduce keys shared with the reduce keys from the document we started from. That is going to make explaining, and debugging, map/reduce so much easier.

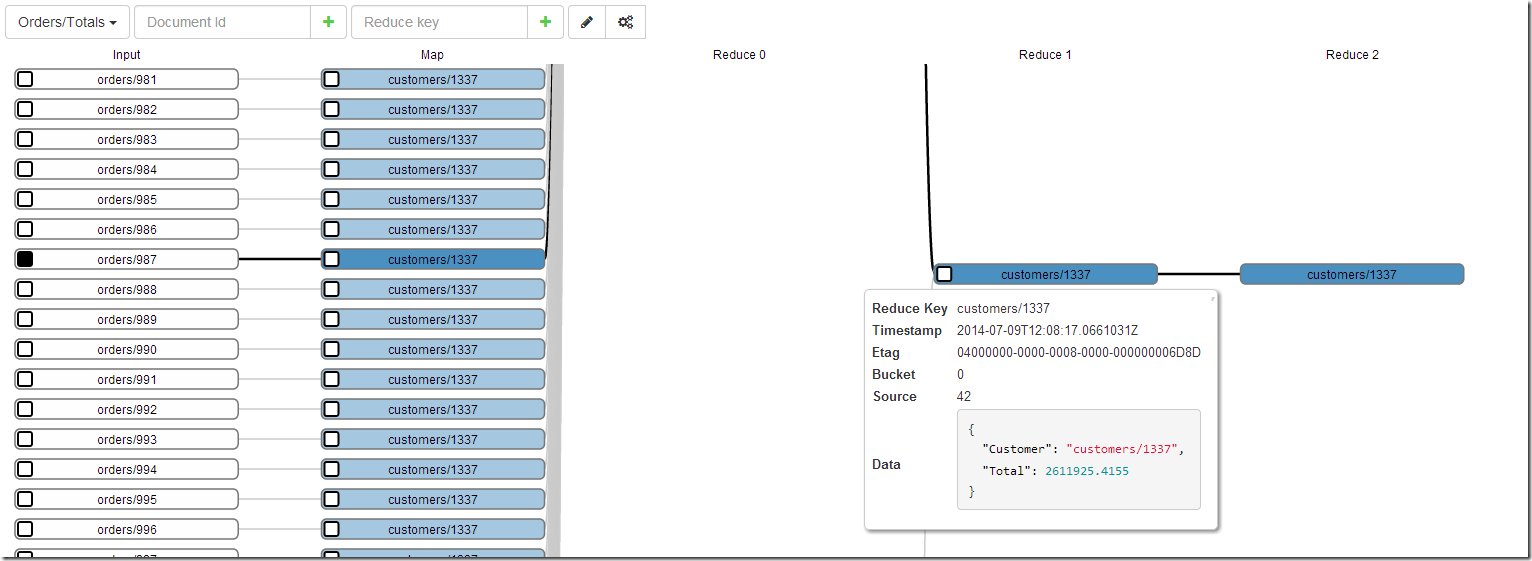
For that matter, here is an example of the visualizer showing us a multi step reduce. Which is an optimization that happens when we have a lot of entries for the same reduce key. Now we can actually show you how this works:

image

Pretty cool!

time to read 4 min | 627 words

Yes, I choose the title on purpose. The topic of this post is this issue. In RavenDB, we use replication to ensure high availability and load balancing. We have been using that for the past five years now, and in general, it has been great, robust and absolutely amazing when you need it.

But like all software, it can run into interesting scenarios. In this case, we had three nodes, call them A, B and C. In the beginning, we had just A & B and node A was the master node, for which all the data was written and node B was there as a hot spare. The customer wanted to upgrade to a new RavenDB version, and they wanted to do that with zero downtime. They setup a new node, with the new RavenDB server, and because A was the master server, they decided to replicate from node B to the new node. Except… nothing appear to be happening.

No documents were replicating to the new node, however, there was a lot of CPU and I/O. But nothing was actually happening. The customer opened a support call, and it didn’t take long to figure out what was going on. The setup the replication between the nodes with the default “replicate only documents that were changed on this node”. However, since this was the hot spare node, no documents were ever changed on that node. All the documents in the server were replicated from the primary node.

The code for that actually look like this:

public IEnumerable<Doc> GetDocsToReplicate(Etag lastReplicatedEtag)
{
foreach(var doc in Docs.After(lastReplicatedEtag)
{
if(ModifiedOnThisDatabase(doc) == false)
continue;
yield return doc;
}
}


var docsToReplicate = GetDocsToReplicate(etag).Take(1024).ToList();
Replicate(docsToReplicate);

However, since there are no documents that were modified on this node, this meant that we had to scan through all the documents in the database. Since this was a large database, this process took time.

The administrators on the server noted the high I/O and that a single thread was constantly busy and decided that this is likely a hung thread. This being the hot spare, they restarted the server. Of course, that aborted the operation midway, and when the database started, it just started everything from scratch.

The actual solution was to tell the database, “just replicate all docs, even those that were replicated to you”. That is the quick fix, of course.

The long term fix was to actually make sure that we abort the operation after a while, report to the remote server that we scanned up to a point, and had nothing to show for it, and go back to the replication loop. The database would then query the remote server for the last etag that was replicated, it would respond with the etag that we asked it to remember, and we’ll continue from that point.

The entire process is probably slower (we make a lot more remote calls, and instead of just going through everything in one go, we have to stop, make a bunch of remote calls, then resume). But the end result is that the process is now resumable. And an admin will be able to see some measure of progress for the replication, even in that scenario.

time to read 4 min | 785 words

This can be a very short post, just: See CAP. Unfortunately, we have a lot of people who actually have experience in using distributed transactions, and have a good reason to believe that they work. The answer is that yes, they do, as long as you don’t run into some of the interesting edge cases.

By the way, that is not a new observation, see The Two Generals.

Allow me to demonstrate. Assume that we have a distributed system with the following actors:

image

This is a fairly typical setup. You have a worker that pull messages from a queue and read/write to a database based on those messages. To coordinate between them, it uses a transaction coordinator such as MSDTC.

Transaction coordinators use a two phase commit (or sometimes a three phase commit protocols) to ensure that either all the data would be committed, or none of it would be.

The general logics goes like this:

  • For each participant in the transaction, send a prepare message.
    • If the participant answered “prepared”, it is guaranteeing that the transaction can be committed.
  • If any of the participants failed on prepare, abort the whole transaction.
  • If all of the participants successfully prepared, send the commit message to all of them.

The actual details are a bit more involved, obviously, but that is pretty much it.

Now, let us take a look at an interesting scenario. Worker #1 is pulling (in a distributed transaction) a message from the queue, and based on that message, it modify the database. Then it tells the transaction coordinator that it can commit the transaction. At this point, the TC is sending the prepare message to the database and the queue. Both reply that they have successfully prepared the transaction to be committed. The TC sends a commit message to the queue, completing the transaction from its point of view, however, at this point, it is unable to communicate with the database.

What happens now?

Before I answer that, let us look at another such scenario. The TC needs to commit a transaction, it sends a prepare message to the database, and receive a successful reply. However, before it manages to send a prepare message to the queue, it becomes unavailable.

Note that from the point of view of the database, the situation looks exactly the same. It got (and successfully replied) to a Prepare message, then it didn’t hear back from the transaction coordinator afterward.

Now, that is where it gets interesting. In an abstract world, we can just wait with the pending transaction until the connection with the coordinator is resumed, and we can actually get a “commit / abort” notification.

But we aren’t in abstract world. When we have such a scenario, we are actually locking records in the database (because they are in the process of being modified). What happens when another client comes to us and want to modify the same record?

For example, it is quite common for to host the business logic, queue and transaction coordinator on the same worker instance, while the database is on a separate machine. That means that in the image above, if Worker #1 isn’t available, we recover by directing all the users to the 2nd worker. However, at that point, we have a transaction that was prepared, but not committed.

When the user continue to make requests to our system, the 2nd worker, which has its own queue and transaction coordinator is going to try and access the user’s record. The same user whose record are currently locked because of the ongoing transaction.

If we just let it hang in this manner, we have essentially created a situation where the user’s data become utterly unavailable (at least for writes). In order to resolve that, transactions comes with a timeout. So after the timeout has expired, we can roll back that transaction. Of course, that leads to a very interesting situation.

Let us go back to the first scenario we explored. In this scenario, the queue got both Prepare & Commit messages, while the database got just a Prepare message. The timeout has expired, and the database has rolled back the transaction.  In other words, as far as the queue is concerned, the transaction committed, and the message is gone. As far as the database is concerned, that transaction was rolled back, and never happened.

Of course, the chance that something like that can happen in one of your systems? Probably one in a million.

time to read 4 min | 683 words

I have an interesting situation that I am not sure how to resolve. We need to record the last request time for a RavenDB database. Now, this last request time is mostly used to show the user, and to decide when a database is idle, and can be shut down.

As such, it doesn’t have to be really accurate ( a skew of even a few seconds is just fine ). However, under load, there are many requests coming in (in the case presented to us, 4,000 concurrent requests), and they all need to update the last request.

Obviously, in such a scenario, we don’t really care about the actual value. But the question is, how do we deal with that? In particular, I want to avoid a situation where we do a lot of writes to the same value in an unprotected manner, mostly because it is likely to cause contentions between cores.

Any ideas?

It is actually fine for us to go slightly back (so thread A at time T+1 and thread B at time T+2 running concurrently, and the end result is T+1), which is why I said that a race is fine for us. But what I want to avoid is any form of locking / contention.

I wrote the following test code:

class Program
{
    static void Main(string[] args)
    {
        var threads = new List<Thread>();

        var holder = new Holder();

        var mre = new ManualResetEvent(false);

        for (int i = 0; i < 2500; i++)
        {
            var thread = new Thread(delegate()
            {
                mre.WaitOne();
                for (long j = 0; j < 500*1000; j++)
                {
                    holder.Now = j;
                }
            });
            thread.Start();
            threads.Add(thread);
        }

        mre.Set();

        threads.ForEach(t => t.Join());


        Console.WriteLine(holder.Now);
    }
}

public class Holder
{
    public long Now;
}

And it looks like it is doing what I want it to. This creates a lot of contention on the same value, but it is also giving me the right value. And again, the value of right here is very approximate. The problem is that I know how to write thread safe code, I’m not sure if this is a good way to go about doing this.

Note that this code (yes, even with 2,500 threads) runs quite fast, in under a second. Trying to use Interlocked.Exchange is drastically more expensive, and Interlocked.CompareExchange is even worse.

But it is just not sitting well with me.

time to read 2 min | 249 words

In my previous post, I did some rough “benchmarks” to see how message passing options behave. I got some great comments, and I thought I’ll expand on that.

The baseline for this was a blocking queue, and we managed to process using that we managed to get:

145,271,000 msgs in 00:00:10.4597977 for 13,888,510 ops/sec

And the async BufferBlock, using which we got:

43,268,149 msgs in 00:00:10 for 4,326,815 ops/sec.

Using LMAX Disruptor we got a disappointing:

29,791,996 msgs in 00:00:10.0003334 for 2,979,100 ops/sec

However, it was pointed out that I can significantly improve this if I changed the code to be:

var disruptor = new Disruptor.Dsl.Disruptor<Holder>(() => new Holder(), new SingleThreadedClaimStrategy(256), new YieldingWaitStrategy(), TaskScheduler.Default);

After which we get a very nice:
141,501,999 msgs in 00:00:10.0000051 for 14,150,193 ops/sec
Another request I got was for testing this with a concurrent queue, which is actually what it is meant to do. The code is actually the same as the blocking queue, we just changed Bus<string> to ConcurrentQueue<string>.
 
Using that, we got:
170,726,000 msgs in 00:00:10.0000042 for 17,072,593 ops/sec
And yes, this is pretty much just because I could. Any of those methods is quite significantly higher than anything close to what I actually need.
time to read 7 min | 1324 words

I got some replies about the async event loop post, mentioning LMAX Disruptor and performance. I decided to see for myself what the fuss was all about.

You can read about the LMAX Disruptor, but basically, it is a very fast single process messaging library.

I wondered what that meant, so I wrote my own messaging library:

public class Bus<T>
{
Queue<T> q = new Queue<T>();

public void Enqueue(T msg)
{
lock (q)
{
q.Enqueue(msg);
}
}

public bool TryDequeue(out T msg)
{
lock (q)
{
if (q.Count == 0)
{
msg = default(T);
return false;
}
msg = q.Dequeue();
return true;
}
}
}

I think that you’ll agree that this is a thing of beauty and elegant coding. I then tested this with the following code:

public static void Read(Bus<string> bus)
{
int count = 0;
var sp = Stopwatch.StartNew();
while (sp.Elapsed.TotalSeconds < 10)
{
string msg;
while (bus.TryDequeue(out msg))
{
count++;
}
}
sp.Stop();

Console.WriteLine("{0:#,#;;0} msgs in {1} for {2:#,#} ops/sec", count, sp.Elapsed, (count / sp.Elapsed.TotalSeconds));
}

public static void Send(Bus<string> bus)
{
var sp = Stopwatch.StartNew();
while (sp.Elapsed.TotalSeconds < 10)
{
for (int i = 0; i < 1000; i++)
{
bus.Enqueue("test");
}
}
}

var bus = new Bus<string>();

ThreadPool.QueueUserWorkItem(state => Send(bus));

ThreadPool.QueueUserWorkItem(state => Read(bus));

The result of this code?

145,271,000 msgs in 00:00:10.4597977 for 13,888,510 ops/sec

Now, what happens when we use the DataFlow’s BufferBlock as the bus?

public static async Task ReadAsync(BufferBlock<string> bus)
{
int count = 0;
var sp = Stopwatch.StartNew();
while (sp.Elapsed.TotalSeconds < 10)
{
try
{
await bus.ReceiveAsync(TimeSpan.FromMilliseconds(5));
count++;
}
catch (TaskCanceledException e)
{
}
}
sp.Stop();

Console.WriteLine("{0:#,#;;0} msgs in {1} for {2:#,#} ops/sec", count, sp.Elapsed, (count / sp.Elapsed.TotalSeconds));
}

public static async Task SendAsync(BufferBlock<string> bus)
{
var sp = Stopwatch.StartNew();
while (sp.Elapsed.TotalSeconds < 10)
{
for (int i = 0; i < 1000; i++)
{
await bus.SendAsync("test");
}
}
}

What we get is:

43,268,149 msgs in 00:00:10 for 4,326,815 ops/sec.

I then decided to check what happens with the .NET port of the LMAX Disruptor. Here is the code:

public class Holder
{
public string Val;
}

internal class CounterHandler : IEventHandler<Holder>
{
public int Count;
public void OnNext(Holder data, long sequence, bool endOfBatch)
{
Count++;
}
}

static void Main(string[] args)
{
var disruptor = new Disruptor.Dsl.Disruptor<Holder>(() => new Holder(), 1024, TaskScheduler.Default);
var counterHandler = new CounterHandler();
disruptor.HandleEventsWith(counterHandler);

var ringBuffer = disruptor.Start();


var sp = Stopwatch.StartNew();
while (sp.Elapsed.TotalSeconds < 10)
{
for (var i = 0; i < 1000; i++)
{
long sequenceNo = ringBuffer.Next();

ringBuffer[sequenceNo].Val = "test";

ringBuffer.Publish(sequenceNo);
}
}
Console.WriteLine("{0:#,#;;0} msgs in {1} for {2:#,#} ops/sec", counterHandler.Count, sp.Elapsed, (counterHandler.Count / sp.Elapsed.TotalSeconds));
}

And the resulting performance is:

29,791,996 msgs in 00:00:10.0003334 for 2,979,100 ops/sec

Now, I’ll be the first to agree that this is really and absolutely not even close to be a fair benchmark. It is testing wildly different things. Distruptor is using a ring buffer, and the BlockBuffer didn’t, and the original Bus implementation just used an unbounded queue.

But that is a very telling benchmark as well. Pretty much because it doesn’t matter. What I need this for is for network protocol handling. As such, even assuming that every single byte is a message, we would have to go far beyond what any reasonable pipe can be expected to be handle.

time to read 4 min | 656 words

I’m designing a new component, and I want to reduce the amount of complexity involved in dealing with it. This is a networked component, and after designing several such, I wanted to remove one area of complexity, which is the use of explicitly concurrent code. Because of that, I decided to go with the following architecture:

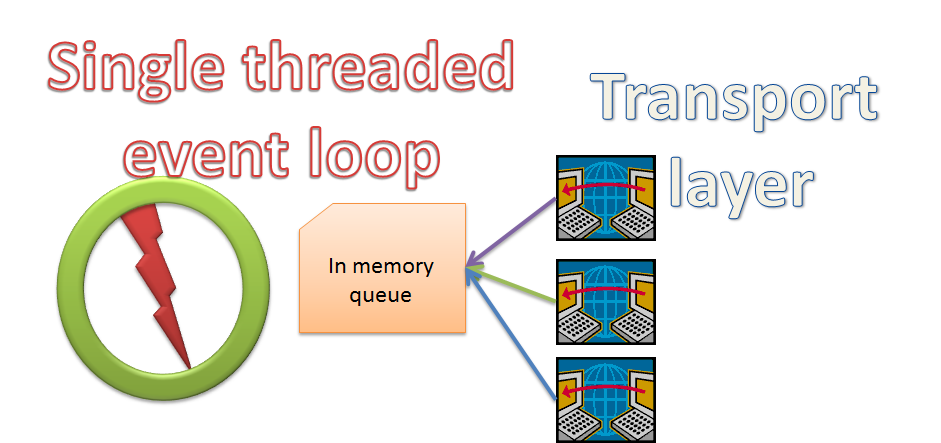
image


The network code is just reading messages from the network, and putting them in an in memory queue. Then we have a single threaded event loop that simply goes over the queue and process those messages.

All of the code that is actually processing messages is single threaded, which make it oh so much easier to work with.

Now, I can do this quite easily with a  BlockingCollection<T>, which is how I usually did those sort of things so far. It is simple, robust and easy to understand. It also tie down a full thread for the event loop, which can be a shame if you don’t get a lot of messages.

So I decided to experiment with async approaches. In particular, using the BufferBlock<T> from the DataFlow assemblies.

I came up with the following code:

var q = new BufferBlock<int>(new DataflowBlockOptions
{
CancellationToken = cts.Token,
});

This just create the buffer block, but the nice thing here is that I can setup a “global” cancellation token for all operations on this. The problem is that this actually generate bad exceptions (InvalidOperationException, instead of TaskCancelledException). Well, I’m not sure if bad is the right term, but it isn’t the one I would expect here, at least. If you pass a cancellation token directly to the method, you get the behavior I expected.

At any rate, the code for the event loop now looks like this:

private static async Task EventLoop(BufferBlock<object> bufferBlock, CancellationToken cancellationToken)
{
while (true)
{
object msg;
try
{
msg = await bufferBlock.ReceiveAsync(TimeSpan.FromSeconds(3), cancellationToken);
}
catch (TimeoutException)
{
NoMessagesInTimeout();
continue;
}
catch (Exception e)
{
break;
}
ProcessMessage(msg);
}
}

And that is pretty much it. We have a good way to handle timeouts, and processing messages, and we don’t take up a thread. We can also be easily cancelled. I still need to run this through a lot more testing, in particular, to verify that this doesn’t cause issues when we need to debug this sort of system, but it looks promising.

FUTURE POSTS

  1. RavenDB GenAI Deep Dive - 17 hours from now
  2. fsync()-ing a directory on Linux (and not Windows) - 4 days from now

There are posts all the way to Jun 09, 2025

RECENT SERIES

  1. Webinar (7):
    05 Jun 2025 - Think inside the database
  2. Recording (16):
    29 May 2025 - RavenDB's Upcoming Optimizations Deep Dive
  3. RavenDB News (2):
    02 May 2025 - May 2025
  4. Production Postmortem (52):
    07 Apr 2025 - The race condition in the interlock
  5. RavenDB (13):
    02 Apr 2025 - .NET Aspire integration
View all series

Syndication

Main feed Feed Stats
Comments feed   Comments Feed Stats
}