As a helpdesk manager,I want the system to automatically assign incoming tickets to available agents in a round-robin manner,so that tickets are distributed evenly and handled efficiently.
That sounds like a pretty simple task, right? Now, let’s get to implementing this. A junior developer will read this story and realize that you need to know who the available agents are and who the last assigned agent was.
Then you realize that you also need to handle more complex scenarios:
What if you have a lot of available agents?
What if we have two concurrent tickets at the same time?
Where do you keep the last assigned agent?
What if an agent goes unavailable and then becomes available again?
How do you handle a lot of load on the system?
What happens if we need to assign a ticket in a distributed manner?
There are answers to each one of those, mind you. It is just that it turns out that round-robin distribution is actually really hard if you want to do that properly.
A junior developer will try to implement the story as written, maybe they know enough to recognize the challenges listed above. If they are good, they will also be able to solve those issues.
A senior developer, in my eyes, would write the following instead:
from Agents
where State ='Available'
order by random()
limit 1
In other words, instead of trying to do “proper” round-robin distribution, with all its attendant challenges, we can achieve pretty much the same thing with far less hassle.
The key difference here is that you need to challenge the requirements, because by changing what you need to do, you can greatly simplify your problem. You end up with a great solution that meets all the users’ requirements (in contrast to what was written in the user story) and introduces almost no complexity.
A good way to do this, by the way, is to reject the story outright and talk to its owner. “You say round-robin here, can I do that randomly? It ends up being the same in the end.”
There may be a reason that mandates the round-robin nature, but if there is such a reason, I can absolutely guarantee that there are additional constraints here that are not expressed in the round-robin description.
That aspect, challenging the problem itself, is a key part of what makes a senior developer more productive. Not just understanding the problem space, but reframing it to make it easier to solve while delivering the same end result.
Today's incident involved a production system failure when one node in the cluster unexpectedly died. That is a scenario RavenDB is designed to handle, and there are well-established (and well-trodden) procedures for recovery.
In this case, the failing node didn’t just crash (which a restart would solve), but actually died. This meant that the admin had to provision a new server and add it to the cluster. This process is, again, both well-established and well-trodden.
As you can tell from the fact that you are reading this post, something went wrong. This cluster is primarily intended to host a single large database (100+ GB in size). When you add a new node to the cluster and add an existing database to it, we need to sync the state between the existing nodes and the new node.
For large databases, that can take a while to complete, which is fine because the new node hasn’t (yet) been promoted to serve users’ requests. It is just slurping all the data until it is in complete sync with the rest of the system. In this case, however… somehow this rookie server got promoted to a full-blown member and started serving user requests.
This is not possible. I repeat, it is not possible. This code has been running in production for over a decade. It has been tested, it has been proven, it has been reviewed, and it has been modeled. And yet… It happened. This sucks.
This postmortem will dissect this distributed systems bug.Debugging such systems is pretty complex and requires specialized expertise. But this particular bug is surprisingly easy to reason about.
Let’s start from the beginning. Here is how the RavenDB cluster decides if a node can be promoted:
defscan_nodes():
states ={}for node in self.cluster.nodes:# retrieve the state of the node (remote call)# - may fail if node is down
state = self.cluster.get_current_state(node)
states[node]= state
for database in self.cluster.databases:
promotables = database.promotable_nodes()iflen(promotables)==0:# nothing to do continuefor promotable in promotables:
mentor = promotable.mentor_node()
mentor_db_state = states[mentor].databases[database.name]if mentor_db_state.faulted:# ignore mentor in faulty statecontinue
promotable_db_state = states[promotable].databases[database.name]if mentor_db_state.last_etag > promotable_db_state.current_etag:continue# the promotable node is up to date as of the last check cycle, promote
self.cluster.promote_node(promotable, database)
The overall structure is pretty simple, we ask each of the nodes in the cluster what its current state is. That gives us an inconsistent view of the system (because we ask different nodes at different times).
To resolve this, we keep both the last and current values. In the code above, you can see that we go over all the promotable nodes and check the current state of each promotable node compared to the last state (from the previous call) of its mentoring node.
The idea is that we can promote a node when its current state is greater than the last state of its mentor (allowing some flexibility for constant writes, etc.).
The code is simple, well-tested, and has been widely deployed for a long time. Staring at this code didn’t tell us anything, it looks like it is supposed to work!
The problem with distributed systems is that there is also all the code involved that is not there. For example, you can see that there is handling here for when the mentor node has failed. In that case, another part of the code would reassign the promotable node to a new mentor, and we’ll start the cycle again.
That was indeed the cause of the problem. Midway through the sync process for the new node, the mentor node failed. That is expected, as I mentioned, and handled. The problem was that there are various levels of failure.
For example, it is very clear that a node that is offline isn’t going to respond to a status request, right?
What about a node that just restarted? It can respond, and for all intents and purposes, it is up & running - except that it is still loading its databases.
Loading a database that exceeds the 100 GB mark can take a while, especially if your disk is taking its time. In that case, what ended up happening was that the status check for the node passed with flying colors, and the status check for the database state returned a loading state.
All the other fields in the database status check were set to their default values…
I think you can see where this is going, right? The problem was that we got a valid status report from a node and didn’t check the status of the individual database state. Then we checked the progress of the promotable database against the mentor state (which was all set to default values).
The promotable node’s current etag was indeed higher than the last etag from the mentor node (since it was the default 0 value), and boom, we have a rookie server being promoted too soon.
The actual fix, by the way, is a single if statement to verify that the state of the database is properly loaded before we check the actual values.
To reproduce this, even after we knew what was going on, was an actual chore, by the way. You need to hit just the right race conditions on two separate machines to get to this state, helped by slow disk, a very large database, and two separate mistimed incidents of server failures.
I build databases for a living, and as such, I spend a great deal of time working with file I/O. Since the database I build is cross-platform, I run into different I/O behavior on different operating systems all the time.
One of the more annoying aspects for a database developer is handling file metadata changes between Windows and Linux (and POSIX in general). You can read more about the details in this excellent post by Dan Luu.
On Windows, the creation of a new file is a reliable operation.If the operation succeeds, the file exists. Note that this is distinct from when you write data to it, which is a whole different topic. The key here is that file creation, size changes, and renames are things that you can rely on.
On Linux, on the other hand, you also need to sync the parent directory (potentially all the way up the tree, by the way). The details depend on what exact file system you have mounted and exactly which flags you are using, etc.
This difference in behavior between Windows and Linux is probably driven by the expected usage, or maybe the expected usage drove the behavior. I guess it is a bit of a chicken-and-egg problem.
It’s really common in Linux to deal with a lot of small files that are held open for a very short time, while on Windows, the recommended approach is to create file handles on an as-needed basis and hold them.
The cost of CreateFile() on Windows is significantly higher than open() on Linux. On Windows, each file open will typically run through a bunch of filters (antivirus, for example), which adds significant costs.
Usually, when this topic is raised, the main drive is that Linux is faster than Windows. From my perspective, the actual issue is more complex. When using Windows, your file I/O operations are much easier to reason about than when using Linux. The reason behind that, mind you, is probably directly related to the performance differences between the operating systems.
In both cases, by the way, the weight of legacy usage and inertia means that we cannot get anything better these days and will likely be stuck with the same underlying issues forever.
Can you imagine what kind of API we would have if we had a new design as a clean slate on today’s hardware?
RavenDB 7.1 introduces Gen AI Integration, enabling seamless integration of various AI models directly within your database. No, you aren’t going to re-provision all your database servers to run on GPU instances; we empower you to leverage any model—be it OpenAI, Mistral, Grok, or any open-source solution on your own hardware.
Our goal is to replicate the intuitive experience of copying data into tools like ChatGPT to ask a question. The idea is to give developers the same kind of experience with their RavenDB documents, and with the same level of complexity and hassle (i.e., none).
The key problem we want to solve is that while copy-pasting to ChatGPT is trivial, actually making use of an AI model in production presents significant logistical challenges. The new GenAI integration feature addresses these complexities. You can use AI models inside your database with the same ease and consistency you expect from a direct query.
The core tenet of RavenDB is that we take the complexity upon ourselves, leaving you with just the juicy bits to deal with. We bring the same type of mindset to Gen AI Integration.
Let’s explore exactly how you use this feature. Then I’ll dive into exactly how this works behind the scenes, and exactly how much load we are carrying for you.
Example: Automatic Product Translations
I’m using the sample database for RavenDB, which is a simple online shop (based on the venerable Northwind database). That database contains products such as these:
Scottish Longbreads
Longlife Tofu
Flotemysost
Gudbrandsdalsost
Rhönbräu Klosterbier
Mozzarella di Giovanni
Outback Lager
Lakkalikööri
Röd Kaviar
I don’t even know what “Rhönbräu Klosterbier” is, for example. I can throw that to an AI model and get a reply back: "Rhön Brewery Monastery Beer." Now at least I know what that is. I want to do the same for all the products in the database, but how can I do that?
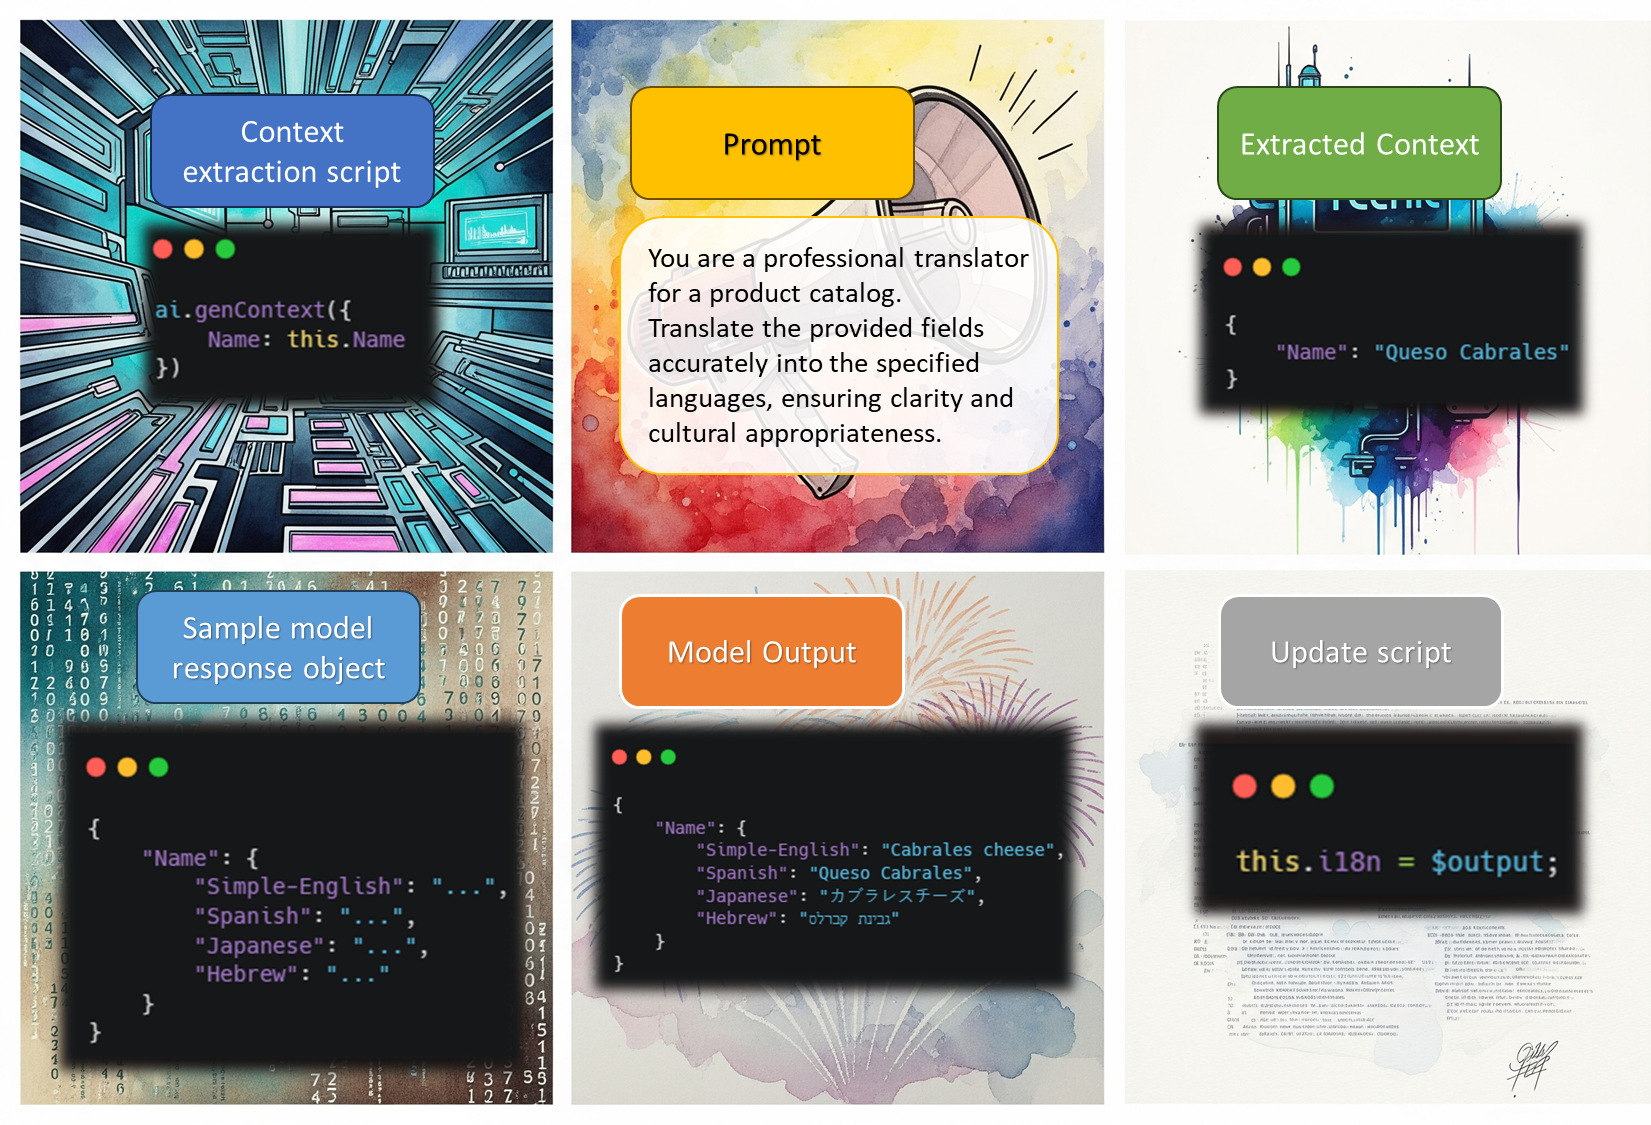
We broke the process itself into several steps, which allow RavenDB to do some really nice things (see the technical deep dive later). But here is the overall concept in a single image. See the details afterward:
Here are the key concepts for the process:
A context extraction script that applies to documents and extracts the relevant details to send to the model.
The prompt that the model is working on (what it is tasked with).
The JSON output schema, which allows us to work with the output in a programmatic fashion.
And finally, the update script that applies the output of the model back to the document.
In the image above, I also included the extracted context and the model output, so you’ll have better insight into what is actually going on.
With all the prep work done, let’s dive directly into the details of making it work.
I’m using OpenAI here, but that is just an example, you can use any model you like (including those that run on your own hardware, of course).
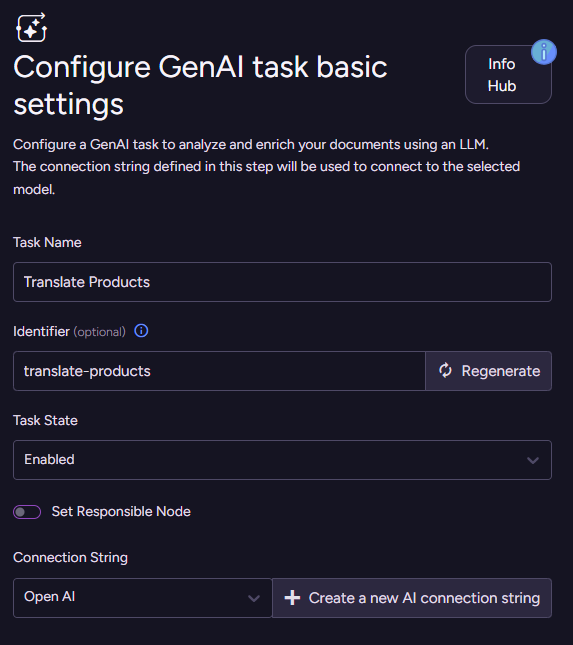
We’ll start the process by defining which model to use. Go to AI Hub > AI Connection Strings and define a new connection string. You need to name the connection string, select OpenAI as the connector, and provide your API key. The next stage is to select the endpoint and the model. I’m using gpt-4o-mini here because it is fast, cheap, and provides pretty good results.
With the model selected, let’s get started. We need to go to AI Hub > AI Tasks > Add AI Task > Gen AI. This starts a wizard to guide you through the process of defining the task. The first thing to do is to name the task and select which connection string it will use. The real fun starts when you click Next.
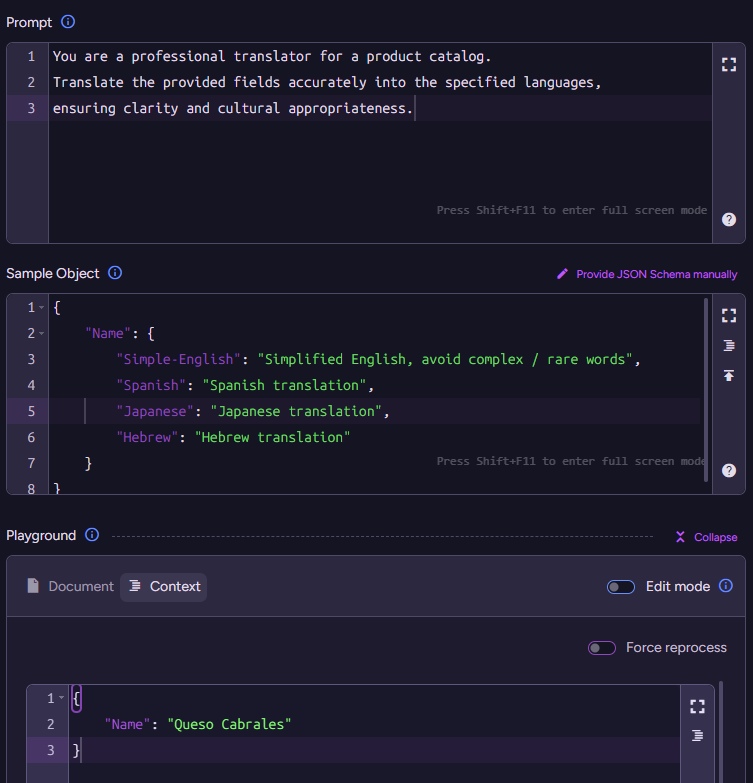
Defining the context
We need to select which collection we’ll operate on (Products) and define something called the Context generation script. What is that about? The idea here is that we don’t need to send the full document to the model to process - we just need to push the relevant information we want it to operate on. In the next stage, we’ll define what is the actual operation, but for now, let’s see how this works.
The context generation script lets you select exactly what will be sent to the model. The method ai.genContext generates a context object from the source document. This object will be passed as input to the model, along with a Prompt and a JSON schema defined later. In our case, it is really simple:
ai.genContext({Name: this.Name
});
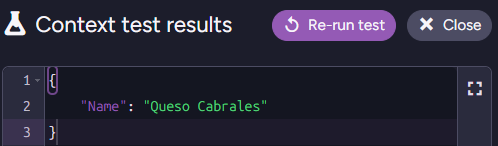
Here is the context object that will be generated from a sample document:
Click Next and let’s move to the Model Input stage, where things really start to get interesting. Here we are telling the model what we want to do (using the Prompt), as well as telling it how it should reply to us (by defining the JSON Schema).
For our scenario, the prompt is pretty simple:
You are a professional translator for a product catalog.
Translate the provided fields accurately into the specified languages, ensuring clarity and cultural appropriateness.
Note that in the prompt, we are not explicitly specifying which languages to translate to or which fields to process. We don’t need to - the fields the model will translate are provided in the context objects created by the "context generation script."
As for what languages to translate, we can specify that by telling the model what the shape of the output should be. We can do that using a JSON Schema or by providing a sample response object. I find it easier to use sample objects instead of writing JSON schemas, but both are supported. You’ll usually start with sample objects for rough direction (RavenDB will automatically generate a matching JSON schema from your sample object) and may want to shift to a JSON schema later if you want more control over the structure.
I find that it is more hygienic to separate the responsibilities of all the different pieces in this manner. This way, I can add a new language to be translated by updating the output schema without touching the prompt, for example.
The text content within the JSON object provides guidance to the model, specifying the intended data for each field.This functions similarly to the description field found in JSON Schema.
We have the prompt and the sample object, which together instruct the model on what to do. At the bottom, you can see the context object that was extracted from the document using the script. Putting it all together, we can send that to the model and get the following output:
The final step is to decide what we’ll do with the model output. This is where the Update Script comes into play.
this.i18n =$output;
This completes the setup, and now RavenDB will start processing your documents based on this configuration. The end result is that your documents will look something like this:
{"Name":"Queso Cabrales","i18n":{"Name":{"Simple-English":"Cabrales cheese","Spanish":"Queso Cabrales","Japanese":"カブラレスチーズ","Hebrew":"גבינת קברלס"}},"PricePerUnit":21,"ReorderLevel":30,// rest of document redacted}
I find it hard to clearly explain what is going on here in text. This is the sort of thing that works much better in a video. Having said that, the basic idea is that we define a Gen AI task for RavenDB to execute. The task definition includes the following discrete steps: defining the connection string; defining the context generation script, which creates context objects; defining the prompt and schema; and finally, defining the document update script. And then we’re done.
The context objects, prompt, and schema serve as input to the model. The update script is executed for each output object received from the model, per context object.
From this point onward, it is RavenDB’s responsibility to communicate with the model and handle all the associated logistics. That means, of course, that if you want to go ahead and update the name of a product, RavenDB will automatically run the translation job in the background to get the updated value.
When you see this at play, it feels like absolute magic. I haven’t been this excited about a feature in a while.
Diving deep into how this works
A large language model is pretty amazing, but getting consistent and reliable results from it can be a chore. The idea behind Gen AI Integration in RavenDB is that we are going to take care of all of that for you.
Your role, when creating such Gen AI Tasks, is to provide us with the prompt, and we’ll do the rest. Well… almost. We need a bit of additional information here to do the task properly.
The prompt defines what you want the model to do. Because we aren’t showing the output to a human, but actually want to operate on it programmatically, we don’t want to get just raw text back. We use the Structured Output feature to define a JSON Schema that forces the model to give us the data in the format we want.
It turns out that you can pack a lot of information for the model about what you want to do using just those two aspects. The prompt and the output schema work together to tell the model what it should do for each document.
Controlling what we send from each document is the context generation script. We want to ensure that we aren’t sending irrelevant or sensitive data. Model costs are per token, and sending it data that it doesn’t need is costly and may affect the result in undesirable ways.
Finally, there is the update script, which takes the output from the model and updates the document. It is important to note that the update script shown above (which just stores the output of the model in a property on the document) is about the simplest one that you can have.
Update scripts are free to run any logic, such as marking a line item as not appropriate for sale because the customer is under 21. That means you don’t need to do everything through the model, you can ask the model to apply its logic, then process the output using a simple script (and in a predictable manner).
What happens inside?
Now that you have a firm grasp of how all the pieces fit together, let’s talk about what we do for you behind the scenes. You don’t need to know any of that, by the way. Those are all things that should be completely opaque to you, but it is useful to understand that you don’t have to worry about them.
Let’s talk about the issue of product translation - the example we have worked with so far. We define the Gen AI Task, and let it run. It processes all the products in the database, generating the right translations for them. And then what?
The key aspect of this feature is that this isn’t a one-time operation. This is an ongoing process. If you update the product’s name again, the Gen AI Task will re-translate it for you. It is actually quite fun to see this in action. I have spent <undisclosed> bit of time just playing around with it, modifying the data, and watching the updates streaming in.
That leads to an interesting observation: what happens if I update the product’s document, but not the name? Let’s say I changed the price, for example. RavenDB is smart about it, we only need to go to the model if the data in the extracted context was modified. In our current example, this means that only when the name of the product changes will we need to go back to the model.
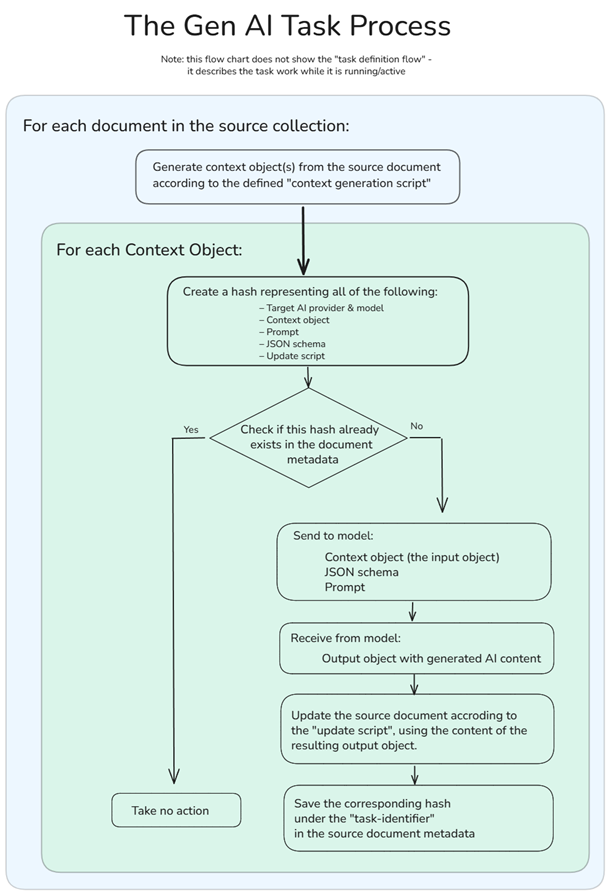
How does RavenDB know when to go back to the model?
When you run the Gen AI Task, RavenDB stores a hash representing the work done by the task in the document’s metadata. If the document is modified, we can run the context generation script to determine whether we need to go to the model again or if nothing has changed from the previous time.
RavenDB takes into account the Prompt, JSON Schema, Update Script, and the generated context object when comparing to the previous version. A change to any of them indicates that we should go ask the model again. If there is no change, we simply skip all the work.
In this way, RavenDB takes care of detecting when you need to go to the model and when there is no need to do so. The key aspect is that you don’t need to do anything for this to work. It is just the way RavenDB works for you.
That may sound like a small thing, but it is actually quite profound. Here is why it matters:
Going to the model is slow - it can take multiple seconds (and sometimes significantly longer) to actually get a reply from the model. By only asking the model when we know the data has changed, we are significantly improving overall performance.
Going to the model is expensive - you’ll usually pay for the model by the number of tokens you consume. If you go to the model with an answer you already got, that’s simply burning money, there’s no point in doing that.
As a user, that is something you don’t need to concern yourself with. You tell RavenDB what you want the model to do, what information from the document is relevant, and you are done.
You can see the entire flow of this process in the following chart:
Let’s consider another aspect. You have a large product catalog and want to run this Gen AI Task. Unfortunately, AI models are slow (you may sense a theme here), and running each operation sequentially is going to take a long time. You can tell RavenDB to run this concurrently, and it will push as much as the AI model (and your account’s rate limits) allow.
Speaking of rate limits, that is sadly something that is quite easy to hit when working with realistic datasets (a few thousand requests per minute at the paid tier). If you need to process a lot of data, it is easy to hit those limits and fail. Dealing with them is also something that RavenDB takes care of for you. RavenDB will know how to properly wait, scale back, and ensure that you are using the full capacity at your disposal without any action on your part.
The key here is that we enable your data to think, and doing that directly in the database means you don’t need to reach for complex orchestrations or multi-month integration projects. You can do that in a day and reap the benefits immediately.
Applicable scenarios for Gen AI Integration in RavenDB
By now, I hope that you get the gist of what this feature is about. Now I want to try to blow your mind and explore what you can do with it…
Automatic translation is just the tip of the iceberg. I'm going to explore a few such scenarios, focusing primarily on what you’ll need to write to make it happen (prompt, etc.) and what this means for your applications.
Unstructured to structured data (Tagging & Classification)
Let’s say you are building a job board where companies and applicants can register positions and resumes. One of the key problems is that much of your input looks like this:
Date: May 28,2025Company: Example's Financial
Title: Senior Accountant
Location: Chicago
Join us as a Senior Accountant, where you will prepare financial statements, manage the general ledger, ensure compliance with tax regulations, conduct audits, and analyze budgets. We seek candidates with a Bachelor’s in Accounting, CPA preferred, 5+ years of experience, and proficiency in QuickBooks and Excel. Enjoy benefits including health, dental, and vision insurance, 401(k) match, and paid time off. The salary range is $80,000 - $100,000 annually. This is a hybrid role with 3 days on-site and 2 days remote.
A simple prompt such as:
You are tasked with reading job applications and transforming them into structure data, following the provided output schema. Fill in additional details where it is relevant (state from city name, for example) but avoid making stuff up.


For requirements, responsibilities and benefits - use tag like format min-5-years, office, board-certified, etc.
Giving the model the user-generated text, we’ll get something similar to this:
You can then plug that into your system and have a much easier time making sense of what is going on.
In the same vein, but closer to what technical people are used to: imagine being able to read a support email from a customer and extract what version they are talking about, the likely area of effect, and who we should forward it to.
This is the sort of project you would have spent multiple months on previously. Gen AI Integration in RavenDB means that you can do that in an afternoon.
Using a large language model to make decisions in your system
For this scenario, we are building a help desk system and want to add some AI smarts to it. For example, we want to provide automatic escalation for support tickets that are high value, critical for the user, or show a high degree of customer frustration.
Here is an example of a JSON document showing what the overall structure of a support ticket might look like. We can provide this to the model along with the following prompt:
You are an AI tasked with evaluating a customer support ticket thread to determine if it requires escalation to an account executive.
Your goal is to analyze the thread, assess specific escalation triggers,and determine if an escalation is required.
Reasons to escalate:* High value customer
* Critical issue, stopping the business
* User is showing agitataion / frustration / likely to leave us
We also ask the model to respond using the following structure:
{"escalationRequired":false,"escalationReason":"TechnicalComplexity | UrgentCustomerImpact | RecurringIssue | PolicyException","reason":"Details on why escalation was recommended"}
If you run this through the model, you’ll get a result like this:
{"escalationRequired":true,"escalationReason":"UrgentCustomerImpact","reason":"Customer reports critical CRM dashboard failure, impacting business operations, and expresses frustration with threat to switch providers."}
The idea here is that if the model says we should escalate, we can react to that. In this case, we create another document to represent this escalation. Other features can then use that to trigger a Kafka message to wake the on-call engineer, for example.
Note that now we have graduated from “simple” tasks such as translating text or extracting structured information to full-blown decisions, letting the model decide for us what we should do. You can extend that aspect by quite a bit in all sorts of interesting ways.
Security & Safety
A big part of utilizing AI today is understanding that you cannot fully rely on the model to be trustworthy. There are whole classes of attacks that can trick the model into doing a bunch of nasty things.
Any AI solution needs to be able to provide a clear story around the safety and security of your data and operations. For Gen AI Integration in RavenDB, we have taken the following steps to ensure your safety.
You control which model to use. You aren’t going to use a model that we run or control. You choose whether to use OpenAI, DeepSeek, or another provider. You can run on a local Ollama instance that is completely under your control, or talk to an industry-specific model that is under the supervision of your organization.
RavenDB works with all modern models, so you get to choose the best of the bunch for your needs.
You control which data goes out. When building Gen AI tasks, you select what data to send to the model using the context generation script. You can filter sensitive data or mask it. Preferably, you’ll send just the minimum amount of information that the model needs to complete its task.
You control what to do with the model’s output. RavenDB doesn’t do anything with the reply from the model. It hands it over to your code (the update script), which can make decisions and determine what should be done.
Summary
To conclude, this new feature makes it trivial to apply AI models in your systems, directly from the database. You don’t need to orchestrate complex processes and workflows - just let RavenDB do the hard work for you.
There are a number of scenarios where this can be extremely useful. From deciding whether a comment is spam or not, to translating data on the fly, to extracting structured data from free-form text, to… well, you tell me. My hope is that you have some ideas about ways that you can use these new options in your system.
I’m really excited that this is now available, and I can’t wait to see what people will do with the new capabilities.
On Jun 11, 2025 I’m going to do a Big Reveal of RavenDB’s new Gen AI capabilities in a public webinar. RavenDB's new feature for automated decision-making, content classification, and data enrichment. We'll cover the behind-the-scenes mechanics and how RavenDB simplifies AI logistics, letting you focus on building your system. Discover how to build AI features without breaking the bank or your release schedule.
The big news in this release is the new Gen AI integration. You are now able to define Generative AI tasks on your own data.
I have a Deep Dive post that talks about it in detail, but the gist of it is that you can write prompts like:
Translate the Product titles in our catalog from English to Spanish, Greek, and Japanese.
Read the Job Postings’ descriptions and extract the years of experience, required skills, salary range, and associated benefits into this well-defined structure.
Analyze Helpdesk Tickets and decide whether we need to escalate to a higher tier.
RavenDB will take the prompt and your LLM of choice and apply it transparently to your data. This allows your data to think.
There is no need for complex integrations or months-long overtime work, just tell RavenDB what you want, and the changes will show up in your database.
I’m really excited about this feature. You can start by downloading the new bits and taking it for a spin, check it out under the AI Hub > AI Tasks menu item in the Studio.
The deep dive post is also something that you probably want to go through 🙂.
As usual, I would dearly love your feedback on the feature and what you can do with it..
Yesterday I gave a live talk about some of the re-design we did to the internals of RavenDB’s storage engine (Voron). I think it went pretty well, and the record is here.
Tomorrow I’m going to be doing a Discord webinar about the deep optimizations we did in how RavenDB talks to the disk.
We are talking about some of the biggest changes to the internals in a decade or so, with the accompanying performance numbers to justify that. I had a great time preparing for that, and I’m really hoping to see you there.
When building RavenDB 7.0, a major feature was Vector Search and AI integration.We weren't the first database to make Vector Search a core feature, and that was pretty much by design.
Not being the first out of the gate meant that we had time to observe the industry, study new research, and consider how we could best enable Vector Search for our users. This isn’t just about the algorithm or the implementation, but about the entire mindset of how you provide the feature to your users. The logistics of a feature dictate how effectively you can use it, after all.
This post is prompted by the recent release of SQL Server 2025 Preview, which includes Vector Search indexing.Looking at what others in the same space are doing is fascinating. The SQL Server team is using the DiskANN algorithm for their Vector Search indexes, and that is pretty exciting to see.
The DiskANN algorithm was one of the algorithms we considered when implementing Vector Search for RavenDB. We ended up choosing the HNSW algorithm as the basis for our vector indexing.This is a common choice; most databases with both indexing options use HNSW. PostgreSQL, MongoDB, Redis, and Elasticsearch all use HNSW.
Microsoft’s choice to use DiskANN isn’t surprising (DiskANN was conceived at Microsoft, after all). I also assume that Microsoft has sufficient resources and time to do a good job actually implementing it. So I was really excited to see what kind of behavior the new SQL Server has here.
RavenDB's choice of HNSW for vector search ended up being pretty simple.Of all the algorithms considered, it was the only one that met our requirements.These requirements are straightforward: Vector Search should function like any other index in the system. You define it, it runs, your queries are fast. You modify the data, the index is updated, your queries are still fast.
I don’t think this is too much to ask :-), but it turned out to be pretty complicated when we look at the Vector Search indexes. Most vector indexing solutions have limitations, such as requiring all data upfront (ANNOY, SCANN) or degrading over time (IVF Flat, LSH) with modifications.
HNSW, on the other hand, builds incrementally and operates efficiently on inserted, updated, and deleted data without significant maintenance.
Therefore, it was interesting to examine the DiskANN behavior in SQL Server, as it's a rare instance of a world-class algorithm available from the source that I can start looking at.
I must say I'm not impressed. I’m not talking about the actual implementation, but rather the choices that were made for this feature in general. As someone who has deeply explored this topic and understands its complexities, I believe using vector indexes in SQL Server 2025, as it currently appears, will be a significant hassle and only suitable for a small set of scenarios.
I tested the preview using this small Wikipedia dataset, which has just under 500,000 vectors and less than 2GB of data – a tiny dataset for vector search.On a Docker instance with 12 cores and 32 GB RAM, SQL Server took about two and a half hours to create the index!
In contrast, RavenDB will index the same dataset in under two minutes.I might have misconfigured SQL Server or encountered some licensing constraints affecting performance, but the difference between 2 minutes and 150 minutes is remarkable. I’m willing to let that one go, assuming I did something wrong with the SQL Server setup.
Another crucial aspect is that creating a vector index in SQL Server has other implications. Most notably, the source table becomes read-only and is fully locked during the (very long) indexing period.
This makes working with vector indexes on frequently updated data very challenging to impossible. You would need to copy data every few hours, perform indexing (which is time-consuming), and then switch which table you are querying against – a significant inconvenience.
Frankly, it seems suitable only for static or rarely updated data, for example, if you have documentation that is updated every few months.It's not a good solution for applying vector search to dynamic data like a support forum with continuous questions and answers.
I believe the design of SQL Server's vector search reflects a paradigm where all data is available upfront, as discussed in research papers. DiskANN itself is immutable once created. There is another related algorithm, FreshDiskANN, which can handle updates, but that isn’t what SQL Server has at this point.
The problem is the fact that this choice of algorithm is really not operationally transparent for users. It will have serious consequences for anyone trying to actually make use of this for anything but frozen datasets.
In short, even disregarding the indexing time difference, the ability to work with live data and incrementally add vectors to the index makes me very glad we chose HNSW for RavenDB. The entire problem just doesn’t exist for us.