programmers have a dumb chip on their shoulder that makes them try and emulate traditional engineering there is zero physical cost to iteration in software - can delete and start over, can live patch our approach should look a lot different than people who build bridges
I have to say that I would strongly disagree with this statement. Using the building example, it is obvious that moving a window in an already built house is expensive. Obviously, it is going to be cheaper to move this window during the planning phase.
The answer is that it may be cheaper, but it won’t necessarily be cheap. Let’s say that I want to move the window by 50 cm to the right. Would it be up to code? Is there any wiring that needs to be moved? Do I need to consider the placement of the air conditioning unit? What about the emergency escape? Any structural impact?
This is when we are at the blueprint stage - the equivalent of editing code on screen. And it is obvious that such changes can be really expensive. Similarly, in software, every modification demands a careful assessment of the existing system, long-term maintenance, compatibility with other components, and user expectations.This intricate balancing act is at the core of the engineering discipline.
A civil engineer designing a bridge faces tangible constraints: the physical world, regulations, budget limitations, and environmental factors like wind, weather, and earthquakes.While software designers might not grapple with physical forces, they contend with equally critical elements such as disk usage, data distribution, rules & regulations, system usability, operational procedures, and the impact of expected future changes.
Evolving an existing software system presents a substantial engineering challenge.Making significant modifications without causing the system to collapse requires careful planning and execution.The notion that one can simply "start over" or "live deploy" changes is incredibly risky.History is replete with examples of major worldwide outages stemming from seemingly simple configuration changes.A notable instance is the Google outage of June 2025, where a simple missing null check brought down significant portions of GCP. Even small alterations can have cascading and catastrophic effects.
I’m currently working on a codebase whose age is near the legal drinking age. It also has close to 1.5 million lines of code and a big team operating on it. Being able to successfully run, maintain, and extend that over time requires discipline.
In such a project, you face issues such as different versions of the software deployed in the field, backward compatibility concerns, etc. For example, I may have a better idea of how to structure the data to make a particular scenario more efficient. That would require updating the on-disk data, which is a 100% engineering challenge. We have to take into consideration physical constraints (updating a multi-TB dataset without downtime is a tough challenge).
The moment you are actually deployed, you have so many additional concerns to deal with. A good example of this may be that users are used to stuff working in a certain way. But even for software that hasn’t been deployed to production yet, the cost of change is high.
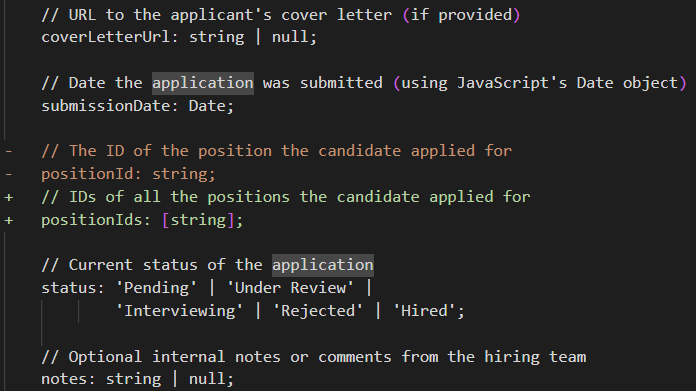
Consider the effort associated with this update to a JobApplication class:
This looks like a simple change, right? It just requires that you (partial list):
Set up database migration for the new shape of the data.
Migrate the existing data to the new format.
Update any indexes and queries on the position.
Update any endpoints and decide how to deal with backward compatibility.
Create a new user interface to match this whenever we create/edit/view the job application.
Consider any existing workflows that inherently assume that a job application is for a single position.
Can you be partially rejected? What is your status if you interviewed for one position but received an offer for another?
How does this affect the reports & dashboard?
This is a simple change, no? Just a few characters on the screen. No physical cost. But it is also a full-blown Epic Task for the project - even if we aren’t in production, have no data to migrate, or integrations to deal with.
Software engineersoperate under constraints similar to other engineers, including severe consequences for mistakes (global system failure because of a missing null check). Making changes to large, established codebases presents a significant hurdle.
The moment that you need to consider more than a single factor, whether in your code or in a bridge blueprint, there is a pretty high cost to iterations. Going back to the bridge example, the architect may have a rough idea (is it going to be a Roman-style arch bridge or a suspension bridge) and have a lot of freedom to play with various options at the start. But the moment you begin to nail things down and fill in the details, the cost of change escalates quickly.
Finally, just to be clear, I don’t think that the cost of changing software is equivalent to changing a bridge after it was built. I simply very strongly disagree that there is zero cost (or indeed, even low cost) to changing software once you are past the “rough draft” stage.
We got an interesting use case from a customer - they need to verify that documents in RavenDB have not been modified by any external party, including users with administrator credentials for the database.
This is known as the Rogue Root problem, where you have to protect yourself from potentially malicious root users. That is not an easy problem - in theory, you can safeguard yourself using various means, for example the whole premise of SELinux is based on that.
I don’t really like that approach, since I assume that if a user has (valid) root access, they also likely have physical access. In other words, they can change the operating system to bypass any hurdles in the way.
Luckily, the scenario we were presented with involved detecting changes made by an administrator, which is significantly easier. And we can also use some cryptography tools to help us handle even the case of detecting malicious tampering.
First, I’m going to show how to make this work with RavenDB, then we’ll discuss the implications of this approach for the overall security of the system.
The implementation
The RavenDB client API allows you to hook into the saving process of documents, as you can see in the code below. In this example, I’m using a user-specific ECDsa key (by calling the GetSigningKeyForUser() method).
store.OnBeforeStore +=(sender, e)=>{
using var obj = e.Session.JsonConverter.ToBlittable(e.Entity,null);var date = DateTime.UtcNow.ToString("O");var data = Encoding.UTF8.GetBytes( e.DocumentId + date + obj);
using ECDsa key =GetSigningKeyForUser(CurrentUser);var signData = key.SignData(data, HashAlgorithmName.SHA256);
e.DocumentMetadata["DigitalSignature"]=newDictionary<string, string>{["User"]= CurrentUser,["Signature"]= Convert.ToBase64String(signData),["Date"]= date,["PublicKey"]= key.ExportSubjectPublicKeyInfoPem()};};
What you can see here is that we are using the user’s key to generate a signature that is composed of:
The document’s ID.
The current signature time.
The JSON content of the entity.
After we generate the signature, we add it to the document’s metadata. This allows us to verify that the entity is indeed valid and was signed by the proper user.
To validate this afterward, we use the following code:
bool ValidateEntity<T>(IAsyncDocumentSession session,T entity){var metadata = session.Advanced.GetMetadataFor(entity);var documentId = session.Advanced.GetDocumentId(entity);var digitalSignature = metadata.GetObject("DigitalSignature")??thrownewIOException("Signature is missing for "+ documentId);var date = digitalSignature.GetString("Date");var user = digitalSignature.GetString("User");var signature = digitalSignature.GetString("Signature");
using var key =GetPublicKeyForUser(user);
using var obj = session.Advanced.JsonConverter.ToBlittable(entity,null);var data = Encoding.UTF8.GetBytes(documentId + date + obj);var bytes = Convert.FromBase64String(signature);return key.VerifyData(data, bytes, HashAlgorithmName.SHA256);}
Note that here, too, we are using the GetPublicKeyForUser() to get the proper public key to validate the signature. We use the specified user from the metadata to get the key, and we verify the signature against the document ID, the date in the metadata, and the JSON of the entity.
We are also saving the public key of the signing user in the metadata. But we haven’t used it so far, why are we doing this?
The reason we use GetPublicKeyForUser() in the ValidateEntity() call is pretty simple: we want to get the user’s key from the same source. This assumes that the user’s key is stored in a safe location (a secure vault or a hardware key like YubiKey, etc.).
The reason we want to store the public key in the metadata is so we can verify the data on the server side. I created the following index:
from c in docs.Companies
let unverified = Crypto.Verify(c)
where unverified is not null
select new{
Problem = unverified
}
I’m using RavenDB’s additional sources feature to add the following code to the index. This exposes the Crypto.Verify() call to the index, and the code uses the public key in the metadata (as well as the other information there) to verify that the document signature is valid.
The index code above will filter all the documents whose signature is valid, so you can easily get all the problematic documents. In other words, it is a quick way of saying: “Find me all the documents whose verification failed”. For compliance, that is quite important and usually requires going over the entire dataset to answer it.
The implications
Let’s consider the impact of such a system. We now have cryptographic verification that the document was modified by a specific user. Any tampering with the document will invalidate the digital signature (or require signing it with your key).
Combine that with RavenDB’s revisions, and you have an immutable log that you can verify using modern cryptography. No, it isn’t a blockchain, but it will put a significant roadblock in the path of anyone trying to just modify the data.
The fact that we do the signing on the client side, rather than the server, means that the server never actually has access to the signing keys (only the public keys). The server’s administrator, in the same manner, doesn’t have a way to get those signing keys and forge a document.
In other words, we solved the Rogue Root problem, and we ensured that a user cannot repudiate a document they signed. It is easy to audit the system for invalid documents (and, combined with revisions, go back to a valid one).
Escape hatch design
If you need this sort of feature for compliance only, you may want to skip the ValidateEntity() call. That would allow an administrator to manually change a document (thus invalidating the digital signature) and still have the rest of the system work. That goes against what we are trying to do, yes, but it is sometimes desirable.
That isn’t required for the normal course of operations, but it can be required for troubleshooting, for example. I’m sure you can think of a number of reasons why it would make things a lot easier to fix if you could just modify the database’s data.
For example, an Order contains a ZipCode with the value "02116" (note the leading zero), which a downstream system turns into the integer 02116. An administrator can change the value to be " 02116", with a leading space, preventing this problem (the downstream system will not convert this to a number, thus keeping the leading 0). Silly, yes - but it happens all the time.
Even though we are invalidating the digital signature, we may want to do that anyway. The index we defined would alert on this, but we can proceed with processing the order, then fix it up later. Or just make a note of this for compliance purposes.
Summary
This post walks you through building a cryptographic solution to protect document integrity within a RavenDB environment, addressing the Rogue Root problem. The core mechanism is a client-side OnBeforeStore hook that generates an ECDsa digital signature for each document. This design ensures that the private keys are never exposed on the server, preventing a database administrator from forging signatures and providing true non-repudiation.
A RavenDB index is used to automatically and asynchronously verify every document's signature against its current content. This index filters for any documents where the digital signature is valid, providing an efficient server-side audit mechanism to find all the documents with invalid signatures.
The really fun part here is that there isn’t really a lot of code or complexity involved, and you get strong cryptographic proof that your data has not been tampered with.
I got a question from one of our users about how they can use RavenDB to manage scheduled tasks. Stuff like: “Send this email next Thursday” or “Cancel this reservation if the user didn’t pay within 30 minutes.”
As you can tell from the context, this is both more straightforward and more complex than the “run this every 2nd Wednesday" you’ll typically encounter when talking about scheduled jobs.
The answer for how to do that in RavenDB is pretty simple, you use the Document Refresh feature. This is a really tiny feature when you consider what it does. Given this document:
RavenDB will remove the @refresh metadata field at the specified time. That is all this does, nothing else. That looks like a pretty useless feature, I admit, but there is a point to it.
The act of removing the @refresh field from the document will also (obviously) update the document, which means that everything that reacts to a document update will also react to this.
I wrote about this in the past, but it turns out there are a lot of interesting things you can do with this. For example, consider the following index definition:
from RoomAvailabilitiesas r
where true and not exists(r."@metadata"."@refresh")selectnew{
r.RoomId,
r.Date,// etc...}
What you see here is an index that lets me “hide” documents (that were reserved) until that reservation expires.
I can do quite a lot with this feature. For example, use this in RabbitMQ ETL to build automatic delayed sending of documents. Let’s implement a “dead-man switch”, a document will be automatically sent to a RabbitMQ channel if a server doesn’t contact us often enough:
if(this['@metadata']["@refresh"])return;// no need to send if refresh didn't expirevar alertData ={Id:id(this),ServerId:this.ServerId,LastUpdate:this.Timestamp,LastStatus:this.Status ||'ACTIVE'};loadToAlertExchange(alertData,'alert.operations',{Id:id(this),Type:'operations.alerts.missing_heartbeat',Source:'/operations/server-down/no-heartbeat'});
The idea is that whenever a server contacts us, we’ll update the @refresh field to the maximum duration we are willing to miss updates from the server. If that time expires, RavenDB will remove the @refresh field, and the RabbitMQ ETL script will send an alert to the RabbitMQ exchange. You’ll note that this is actually reacting to inaction, which is a surprisingly hard thing to actually do, usually.
You’ll notice that, like many things in RavenDB, most features tend to be small and focused. The idea is that they compose well together and let you build the behavior you need with a very low complexity threshold.
The common use case for @refresh is when you use RavenDB Data Subscriptions to process documents. For example, you want to send an email in a week. This is done by writing an EmailToSend document with a @refresh of a week from now and defining a subscription with the following query:
from EmailToSend as e
where true and not exists(e.'@metadata'.'@refresh')
In other words, we simply filter out those that have a @refresh field, it’s that simple. Then, in your code, you can ignore the scheduling aspect entirely. Here is what this looks like:
var subscription =store.Subscriptions
.GetSubscriptionWorker<EmailToSend>("EmailToSendSubscription");awaitsubscription.Run(async batch =>{
using var session =batch.OpenAsyncSession();
foreach (var item inbatch.Items){var email =item.Result;awaitEmailProvider.SendEmailAsync(newEmailMessage{To=email.To,Subject=email.Subject,Body=email.Body,From="no-reply@example.com"});email.Status="Sent";email.SentAt=DateTime.UtcNow;}awaitsession.SaveChangesAsync();});
Note that nothing in this code handles scheduling. RavenDB is in charge of sending the documents to the subscription when the time expires.
Using @refresh + Subscriptions in this manner provides us with a number of interesting advantages:
Missed Triggers: Handles missed schedules seamlessly, resuming on the next subscription run.
Reliability: Automatically retries subscription processing on errors.
Rescheduling: When @refresh expires, your subscription worker will get the document and can decide to act or reschedule a check by updating the @refresh field again.
Robustness: You can rely on RavenDB to keep serving subscriptions even if nodes (both clients & servers) fail.
Scaleout: You can use concurrent subscriptions to have multiple workers read from the same subscription.
You can take this approach really far, in terms of load, throughput, and complexity. The nice thing about this setup is that you don’t need to glue together cron, a message queue, and worker management. You can let RavenDB handle it all for you.
Tomorrow I’ll be giving a webinar on Building AI Agents in RavenDB. I’m going to show off some really cool ways to apply AI agents on your data, as well as our approach to AI and LLM in general.
AI Agents are all the rage now. The mandate has come: “You must have AI integrated into your systems ASAP.” What AI doesn’t matter that much, as long as you have it, right?
Today I want to talk about a pretty important aspect of applying AI and AI Agents in your systems, the security problem that is inherent to the issue. If you add an AI Agent into your system, you can bypass it using a “strongly worded letter to the editor”, basically. I wish I were kidding, but take a look at this guide (one of many) for examples.
There are many ways to mitigate this, including using smarter models (they are also more expensive), adding a model-in-the-middle that validates that the first model does the right thing (slower and more expensive), etc.
In this post, I want to talk about a fairly simple approach to avoid the problem in its entirety. Instead of trying to ensure that the model doesn’t do what you don’t want it to do, change the playing field entirely. Make it so it is simply unable to do that at all.
The key here is the observation that you cannot treat AI models as an integral part of your internal systems. They are simply not trustworthy enough to do so. You have to deal with them, but you don’t have to trust them. And that is an important caveat.
Consider the scenario of a defense attorney visiting a defendant in prison. The prison will allow the attorney to meet with the inmate, but it will not trust the attorney to be on their side. In other words, the prison will cooperate, but only in a limited manner.
What does this mean in practice? It means that the AI Agent should not be considered to be part of your system, even if it is something that you built. Instead, it is an external entity (untrusted) that has the same level of access as the user it represents.
For example, in an e-commerce setting, the agent has access to:
The invoices for the current customer - the customer can already see that, naturally.
The product catalog for the store - which the customer can also search.
Wait, isn’t that just the same as the website that we already give our users? What is the point of the agent in this case?
The idea is that the agent is able to access this data directly and consume it in its raw form. For example, you may allow it to get all invoices in a date range for a particular customer, or browse through the entire product catalog. Stuff that you’ll generally not make easily available to the user (they don’t make good UX for humans, after all).
In the product catalog example, you may expose the flag IsInInventory to the agent, but not the number of items that you have on hand. We are basically treating the agent as if it were the user, with the same privileges and visibility into your system as the user.
The agent is able to access the data directly, without having to browse through it like a user would, but that is all. For actions, it cannot directly modify anything, but must use your API to act (and thus go through your business rules, validation logic, audit trail, etc).
What is the point in using an agent if they are so limited? Consider the following interaction with the agent:
The model here has access to only the customer’s orders and the ability to add items to the cart. It is still able to do something that is quite meaningful for the customer, without needing any additional rights or visibility.
We should embrace the idea that the agents we build aren’t ours. They are acting on behalf of the users, and they should be treated as such. From a security standpoint, they are the user, after all.
The result of this shift in thinking is that the entire concept of trying to secure the agent from doing something it shouldn’t do is no longer applicable. The agent is acting on behalf of the user, after all, with the same rights and the same level of access & visibility. It is able to do things faster than the user, but that is about it.
If the user bypasses our prompt and convinces the agent that it should access the past orders for their next-door neighbor, it should have the same impact as changing the userId query string parameters in the URL. Not because the agent caught that misdirection, but simply because there is no way for the agent to access any information that the user doesn’t have access to.
Any mess the innovative prompting creates will land directly in the lap of the same user trying to be funny. In other words, the idea is to put the AI Agents on the other side of the security hatch.
Once you have done that, then suddenly a lot of your security concerns become invalid. There is no damage the agent can cause that the user cannot also cause on their own.
It’s simple, it’s effective, and it is the right way to design most agentic systems.
The natural way for developers to test out code is in a simple console application. That is a simple, obvious, and really easy way to test things out. It is also one of those things that can completely mislead you about the actual realities of using a particular API.
For example, let’s take a look at what is probably the most trivial chatbot example:
var kernel = Kernel.CreateBuilder().AddAzureOpenAIChatCompletion(...).Build();var chatService = kernel.GetRequiredService<IChatCompletionService>();var chatHistory =newChatHistory("You are a friendly chatbot.");while(true){
Console.Write("User: ");
chatHistory.AddUserMessage(Console.ReadLine());var response =await chatService.GetChatMessageContentAsync(
chatHistory,kernel: kernel);
Console.WriteLine($"Chatbot: {response}");
chatHistory.AddAssistantMessage(response.ToString());}
If you run this code, you’ll be able to have a really interesting chat with the model, and it is pretty amazing that it takes less than 15 lines of code to make it happen.
What is really interesting here is that there is so much going on that you cannot really see. In particular, just how much state is being kept by this code without you actually realizing it.
Let’s look at the same code when we use a web backend for it:
app.MapPost("/chat/{sessionId}", async (string sessionId,
HttpContext context, IChatCompletionService chatService,
ConcurrentDictionary<string, ChatHistory> sessions)=>{
var history= sessions.GetOrAdd(sessionId, _ => new ChatHistory("You are a friendly chatbot."));
var request = await context.Request.ReadFromJsonAsync<UserMessage>();
history.AddUserMessage(request.Message);
var response = await chatService.GetChatMessageContentAsync(history,
kernel: kernel);
history.AddAssistantMessage(response.ToString());return Results.Ok(new { Response = response.ToString()});});
Suddenly, you can see that you have a lot of state to maintain here. In particular, we have the chat history (which we keep around between requests using a concurrent dictionary). We need that because the model requires us to send all the previous interactions we had in order to maintain context.
Note that for proper use, we’ll also need to deal with concurrency - for example, if two requests happen in the same session at the same time…
But that is still a fairly reasonable thing to do. Now, let’s see a slightly more complex example with tool calls, using the by-now venerable get weather call:
publicclassWeatherTools{[KernelFunction("get_weather")][Description("Get weather for a city")]publicstringGetWeather(string city)=>$"Sunny in {city}.";}var builder = Kernel.CreateBuilder().AddAzureOpenAIChatCompletion(...);
builder.Plugins.AddFromType();var kernel = builder.Build();var chatService = kernel.GetRequiredService();var settings =newOpenAIPromptExecutionSettings{
ToolCallBehavior = ToolCallBehavior.AutoInvokeKernelFunctions
};var history =newChatHistory("You are a friendly chatbot with tools.");while(true){
Console.Write("User: ");
history.AddUserMessage(Console.ReadLine());var response =await chatService.GetChatMessageContentAsync(
history, settings, kernel);
history.Add(response);
Console.WriteLine($"Chatbot: {response.Content}");}
The AutoInvokeKernelFunctions setting is doing a lot of work for you that isn’t immediately obvious. The catch here is that this is still pretty small & reasonable code. Now, try to imagine that you need a tool call such as: ReplaceProduct(old, new, reason).
The idea is that if we don’t have one type of milk, we can substitute it with another. But that requires user approval for the change. Conceptually, this is exactly the same as the previous tool call, and it is pretty trivial to implement that:
[KernelFunction("replace_product")][Description("Confirm product replacement with the user")]publicstringReplaceProduct(string old,string replacement,string reason){
Console.WriteLine($"{old} -> {replacement}: {reason}? (yes/no)");return Console.ReadLine();}
Now, in the same way I transformed the first code sample using the console into a POST request handler, try to imagine what you’ll need to write to send this to the browser for a user to confirm that.
That is when you realize that these 20 lines of code have been transformed into managing a lot of state for you. State that you are implicitly storing inside the execution stack.
You need to gather the tool name, ID and arguments, schlep them to the user, and in a new request get their response. Then you need to identify that this is a tool call answer and go back to the model. That is a separate state from handling a new input from the user.
None of the code is particularly crazy, of course, but you now need to handle the model, the backend, and the frontend states.
When looking at an API, I look to see how it handles actual realistic use cases, because it is so very easy to get caught up with the kind of console app demos - and it turns out that the execution stack can carry quite a lot of weight for you.
We have been working with AI models for development a lot lately (yes, just like everyone else). And I’m seesawing between “damn, that’s impressive” and “damn, brainless fool” quite often.
I want to share a few scenarios in which we employed AI to write code, how it turned out, and what I think about the future of AI-generated code and its impact on software development in general.
Porting code between languages & platforms
One place where we are trying to use an AI model is making sure that the RavenDB Client API is up to date across all platforms and languages. RavenDB has a really rich client API, offering features such as Unit of Work, change tracking, caching, etc. This is pretty unique in terms of database clients, I have to say.
That is, this approach comes with a substantial amount of work required. Looking at something like Postgres as a good example, the Postgres client is responsible for sending data to and from the database. The only reason you’d need to update it is if you change the wire format, and that is something you try very hard to never do (because then you have to update a bunch of stuff, deal with compatibility concerns, etc.).
The RavenDB Client API is handling a lot of details. That means that as a user, you get much more out of the box, but we have to spend a serious amount of time & effort maintaining all the various clients that we support. At last count, we had clients for about eight or so platforms (it gets hard to track 🙂). So adding a feature on the client side means that we have to develop the feature (usually in C#), then do the annoying part of going through all the clients we have and updating them.
You have to do that for each client, for each feature. That is… a lot to ask. And it is the kind of task that is really annoying. A developer tasked with this is basically handling copy/paste more than anything else. It also requires a deep understanding of each client API’s platform (Java and Python have very different best practices, for example). That includes how to write high-performance code, idiomatic code, and an easy-to-use API for the particular platform.
In other words, you need to be both an expert and a grunt worker at the same time. This is also one of those cases that is probably absolutely perfect for an AI model. You have a very clearly defined specification (the changes that you are porting from the source client, as a git diff), and you have tests to verify that it did the right thing (you need to port those, of course).
We tried that across a bunch of different clients, and the results are both encouraging and disheartening at the same time. On the one hand, it was able to do the bulk of the work quite nicely. And the amount of work to set it up is pretty small. The problem is that it gets close, but not quite. And taking it the remaining 10% to 15% of the way is still a task you need a developer for.
For example, when moving code from C# to TypeScript, we have to deal with things like C# having both sync and async APIs, while in TypeScript we only have an async API. It created both versions (and made them both async), or it somehow hallucinated the wrong endpoints (but mostly got things right).
The actual issue here is that it is too good: you let it run for a few minutes, then you have 2,000 lines of code to review. And that is actually a problem. Most of the code is annoyingly boilerplate, but you still need to review it. The AI is able to both generate more code than you can keep up with, as well as do some weird stuff, so you need to be careful with the review.
In other words, we saved a bunch of time, but we are still subject to Amdahl's Law. Previously, we were limited by code generation, but now we are limited by the code review. And that is not something you can throw at an agent (no, not even a different one to “verify” it, that is turtles all the way down).
Sample applications & throwaway code
It turns out that we need a lot of “just once” code. For example, whenever we have a new feature out, we want to demonstrate it, and a console application is usually not enough to actually showcase the full feature.
For example, a year and a half ago, we built Hugin, a RavenDB appliance running on a Raspberry Pi Zero. That allowed us to showcase how RavenDB can run on seriously constrained hardware, as well as perform complex full-text search queries at blazing speed.
To actually show that, we needed a full-blown application that would look nice, work on mobile, and have a bunch of features so we could actually show what we have been doing. We spent a couple of thousand to make that application, IIRC, and it took a few weeks to build, test, and verify.
Last week, I built three separate demo applications using what was effectively a full vibe-coding run. The idea was to get something running that I could plug in with less than 50 lines of code that actually did something useful. It worked; it makes for an amazing demo. It also meant that I was able to have a real-world use case for the API and get a lot of important insights about how we should surface this feature to our users.
The model also generated anywhere between 1,500 and 3,000 lines of code per sample app; with fewer than 100 lines of code being written by hand. The experience of being able to go and build such an app so quickly is an intoxicating one. It is also very much a false one. It’s very easy to get stuck way up in a dirty creek, and the AI doesn’t pack any sort of paddles.
For example, I’m not a front-end guy, so I pretty much have to trust the model to do sort of the right thing, but it got stuck a few times. The width of a particular element was about half of what it should be, and repeated attempts to fix that by telling the model to make it expand to the full width of the screen just didn’t “catch”.
It got to the point that I uploaded screenshots of the problem, which made the AI acknowledge the problem, and still not fix it. Side note: the fact that I can upload a screenshot and get it to understand what is going on there is a wow moment for me.
I finally just used dev tools and figured out that there was a root div limiting the width of everything. Once I pointed this out, the model was able to figure out what magic CSS was needed to make it work.
A demo application is a perfect stage for an AI model, because I don’t actually have any other concern other than “make it work”. I don’t care about the longevity of the code, performance, accessibility, or really any of the other “-ities” you usually need to deal with. In other words, it is a write-once, then basically never maintained or worked on.
I’m also perfectly fine with going with the UI and the architecture that the AI produced. If I actually cared exactly what the application looked like, it would be a whole different story. In my experience, actually getting the model to do exactly what I want is extremely complex and usually easier to do by hand.
For sample applications, I can skip actually reviewing all this code (exceeding 10KLOC) and accept that the end result is “good enough” for me to focus on the small bits that I wrote by hand. The same cannot be said for using AI coding in most other serious scenarios.
What used to be multiple weeks and thousands of dollars in spending has now become a single day of work, and less money in AI spend than the cost of the coffee drunk by the prompter in question. That is an amazing value for this use case, but the key for me is that this isn’t something I can safely generalize to other tasks.
Writing code is not even half the battle
It’s an old adage that you shouldn’t judge a developer by how fast they can produce code, because you end up reading code a lot more than writing it. Optimizing code generation is certainly going to save us some time, but not as much as I think people believe it would.
I cited Amdahl's Law above because it fits. For a piece of code to hit production, I would say that it needs to have gone through:
Design & architecture
Coding
Code review
Unit Testing
Quality Assurance
Security
Performance
Backward & forward compatibility evaluation
The interesting thing here is that when you have people doing everything, you’ll usually just see “coding” in the Gantt chart. A lot of those required tasks are done as part of the coding process. And those things take time. Generating code quickly doesn’t give you good design, and AI is really prone to making errors that a human would rarely make.
For example, in the sample apps I mentioned, we had backend and front-end apps, which naturally worked on the same domain. At one point, I counted and I had the following files:
backend/models/order.ts
frontend/models/api-order.ts
frontend/models/order.ts
frontend/models/view-order.ts
They all represented the same-ish concept in the application, were derived from one another, and needed to be kept in sync whenever I made a change to the model. I had to explicitly instruct the model to have a single representation of the model in the entire system.
The interesting bit was that as far as the model was concerned, that wasn’t a problem. Adding a field on the backend would generate a bunch of compilation errors that it would progressively fix each time. It didn’t care about that because it could work with it. But whenever I needed to make a change, I would keep hitting this as a stumbling block.
There are two types of AI code that you’ll see, I believe. The first is code that was generated by AI, but then was reviewed and approved by a person, including taking full ownership & accountability for it. The second is basically slop, stuff that works right now but is going to be instant technical debt from day one. The equivalent of taking payday loans to pay for a face tattoo to impress your high-school crush. In other words, it’s not even good from the first day, and you’ll pay for it in so many ways down the line.
AI-generated code has no intrinsic value
A long time ago (almost 25 years) .NET didn’t have generics. If you wanted to have a strongly typed collection, you had a template that would generate it for you. You could have a template that would read a SQL database schema and generate entire data layers for you, including strongly typed models, data access objects, etc. (That is far enough back that the Repository pattern wasn’t known). It took me a while to remember that the tool I used then was called CodeSmith; there are hardly any mentions of it, but you can see an old MSDN article from the Wayback Machine to get an idea of what it was like.
You could use this approach to generate a lot of code, but no one would ever consider that code to be an actual work product, in the same sense that I don’t consider compiled code to be something that I wrote (even if I sometimes browse the machine code and make changes to affect what machine code is being generated).
In the same sense, I think that AI-generated code is something that has no real value on its own. If I can regenerate that code very quickly, it has no actual value. It is only when that code has been properly reviewed & vetted that you can actually call it valuable.
Take a look at this 128,000-line pull request, for example. The only real option here is to say: “No, thanks”. That code isn’t adding any value, and even trying to read through it is a highly negative experience.
Other costs of code
Last week, I reviewed a pull request; here is what it looked like:
No, it isn’t AI-generated code; it is just a big feature. That took me half a day to go through, think it over, etc. And I reviewed only about half of it (the rest was UI code, where me looking at the code brings no value). In other words, I would say that a proper review takes an experienced developer roughly 1K - 1.5K lines of code/hour. That is probably an estimate on the high end because I was already familiar with the code and did the final review before approving it.
Important note: that is for code that is inherently pretty simple, in an architecture I’m very familiar with. Reviewing complex code, like this review, is literally weeks of effort.
I also haven’t touched on debugging the code, verifying that it does the right thing, and ensuring proper performance - all the other “-ities” that you need to make code worthy of production.
Cost of changing the code is proportional to its size
If you have an application that is a thousand lines of code, it is trivial to make changes. If it has 10,000 lines, that is harder. When you have hundreds of thousands of lines, with intersecting features & concerns, making sweeping changes is now a lot harder.
Consider coming to a completely new codebase of 50,000 lines of code, written by a previous developer of… dubious quality. That is the sort of thing that makes people quit their jobs. That is the sort of thing that we’ll have to face if we assume, “Oh, we’ll let the model generate the app”. I think you’ll find that almost every time, a developer team would rather just start from scratch than work on the technical debt associated with such a codebase.
The other side of AI code generation is that it starts to fail pretty badly as the size of the codebase approaches the context limits. A proper architecture would have separation of concerns to ensure that when humans work on the project, they can keep enough of the system in their heads.
Most of the model-generated code that I reviewed required explicitly instructing the model to separate concerns; otherwise, it kept trying to mix concerns all the time. That worked when the codebase was small enough for the model to keep track of it. This sort of approach makes the code much harder to maintain (and reliant on the model to actually make changes).
You still need to concern yourself with proper software architecture, even if the model is the one writing most of the code. Furthermore, you need to be on guard against the model generating what amounts to “fad of the day” type of code, often with no real relation to the actual requirement you are trying to solve.
AI Agent != Junior developer
It’s easy to think that using an AI agent is similar to having junior developers working for you. In many respects, there are a lot of similarities. In both cases, you need to carefully review their work, and they require proper guidance and attention.
A major difference is that the AI often has access to a vast repository of knowledge that it can use, and it works much faster. The AI is also, for lack of a better term, an idiot. It will do strange things (like rewriting half the codebase) or brute force whatever is needed to get the current task done, at the expense of future maintainability.
The latter problem is shared with junior developers, but they usually won’t hand you 5,000 lines of code that you first have to untangle (certainly not if you left them alone for the time it takes to get a cup of coffee).
The problem is that there is a tendency to accept generated code as given, maybe with a brief walkthrough or basic QA, before moving to the next step. That is a major issue if you go that route; it works for one-offs and maybe the initial stages of greenfield applications, but not at all for larger projects.
You should start by assuming that any code accepted into the project without human review is suspect, and treat it as such. Failing to do so will lead to ever-deeper cycles of technical debt. In the end, your one-month-old project becomes a legacy swamp that you cannot meaningfully change.
This story made the rounds a few times, talking about a non-technical attempt to write a SaaS system. It was impressive because it had gotten far enough along for people to pay for it, and that was when people actually looked at what was going on… and it didn’t end well.
As an industry, we are still trying to figure out what exactly this means, because AI coding is undeniably useful. It is also a tool that has specific use cases and limitations that are not at all apparent at first or even second glance.
AI-generated code vs. the compiler
Proponents of AI coding have a tendency to talk about AI-generated code in the same way they treat compiled code. The machine code that the compiler generates is an artifact and is not something we generally care about. That is because the compiler is deterministic and repeatable.
If two developers compile the same code on two different machines, they will end up with the same output. We even have a name for Reproducible Builds, which ensure that separate machines generate bit-for-bit identical output. Even when we don’t achieve that (getting to reproducible builds is a chore), the code is basically the same. The same code behaving differently after each compilation is a bug in the compiler, not something you accept.
That isn’t the same with AI. Running the same prompt twice will generate different output, sometimes significantly so. Running a full agentic process to generate a non-trivial application will result in compounding changes to the end result.
In other words, it isn’t that you can “program in English”, throw the prompts into source control, and treat the generated output as an artifact that you can regenerate at any time. That is why the generated source code needs to be checked into source control, reviewed, and generally maintained like manually written code.
The economic value of AI code gen is real, meaningful and big
I want to be clear here: I think that there is a lot of value in actually using AI to generate code - whether it’s suggesting a snippet that speeds up manual tasks or operating in agent mode and completing tasks more or less independently.
The fact that I can do in an hour what used to take days or weeks is a powerful force multiplier. The point I’m trying to make in this post is that this isn’t a magic wand. There is also all the other stuff you need to do, and it isn’t really optional for production code.
Summary
In short, you cannot replace your HR department with an IT team managing a bunch of GPUs. Certainly not now, and also not in any foreseeable future. It is going to have an impact, but the cries about “the sky is falling” that I hear about the future of software development as a profession are… about as real as your chance to get rich from paying large sums of money for “ownership” of a cryptographic hash of a digital ape drawing.
I talked with my daughter recently about an old babysitter, and then I pulled out my phone and searched for a picture using “Hadera, beach”. I could then show my daughter a picture of her and the babysitter at the beach from about a decade ago.
I have been working in the realm of databases and search for literally decades now. The image I showed my daughter was taken while I was taking some time off from thinking about what ended up being Corax, RavenDB’s indexing and querying engine 🙂.
It feels natural as a user to be able to search the content of images, but as a developer who is intimately familiar with how this works? That is just a big mountain of black magic. Except… I do know how to make it work. It isn’t black magic, it's just the natural consequence of a bunch of different things coming together.
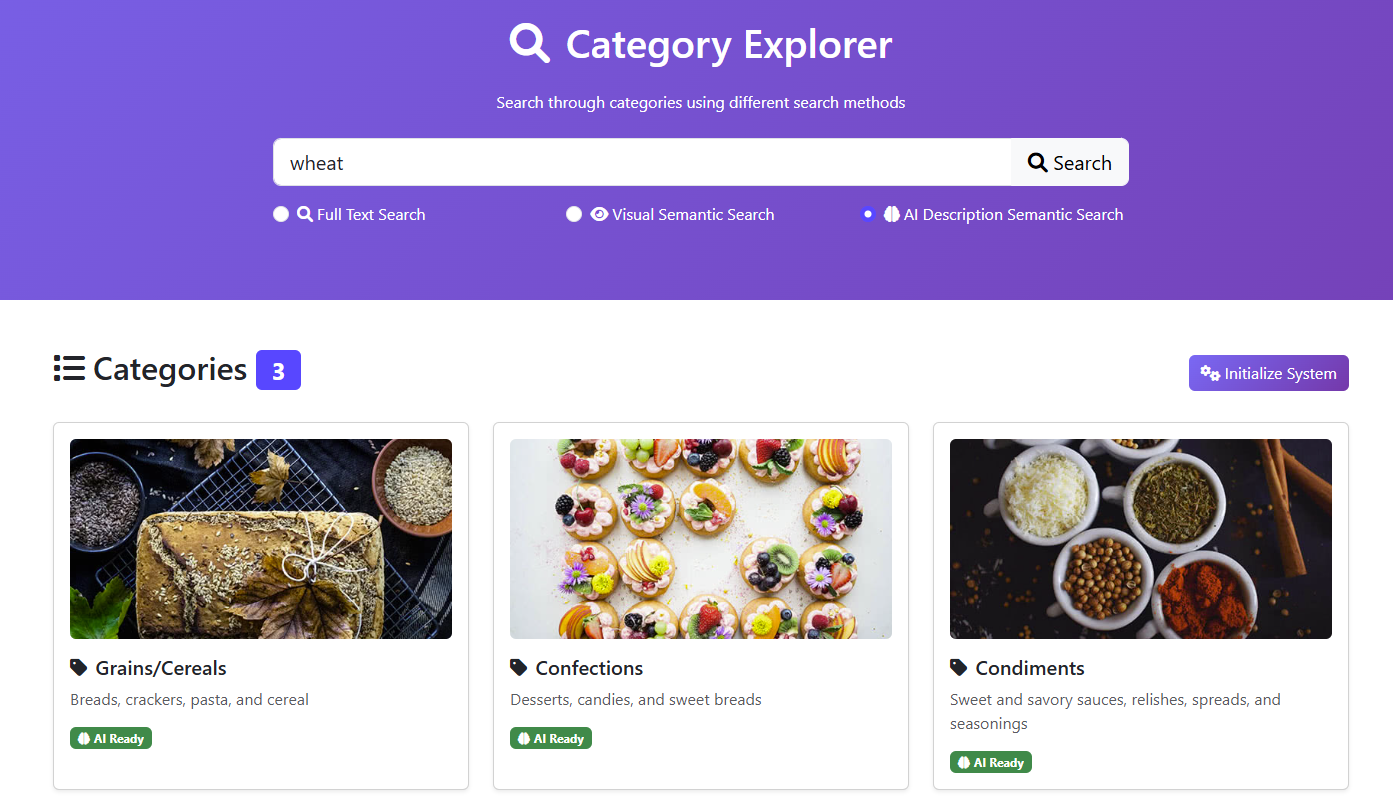
And here is what the application itself looks like:
Let’s talk for a bit about how that actually works, shall we? To be able to search the content of an image, we first need to understand it. That requires a model capable of visual reasoning.
If you are a fan of the old classics, you may recall this XKCD comic from about a decade ago. Luckily, we don’t need a full research team and five years to do that. We can do it with off-the-shelf models.
A small reminder - semantic search is based on the notion of embeddings, a vector that the model returns from a piece of data, which can then be compared to other vectors from the same model to find how close together two pieces of data are in the eyes of the model.
For image search, that means we need to be able to deal with a pretty challenging task. We need a model that can accept both images and text as input, and generate embeddings for both in the same vector space.
There are dedicated models for doing just that, called CLIP models (further reading). Unfortunately, they seem to be far less popular than normal embedding models, probably because they are harder to train and more expensive to run. You can run it locally or via the cloud using Cohere, for example.
Here is an example of the codeyou need to generate an embedding from an image. And here you have the code for generating an embedding from text using the same model. The beauty here is that because they are using the same vector space, you can then simply apply both of them together using RavenDB’s vector search.
// For visual search, we use the same vector search but with more candidates// to find visually similar categories based on image embeddingsvar embedding =await _clipEmbeddingCohere.GetTextEmbeddingAsync(query);var categories =await session.Query<CategoriesIdx.Result, CategoriesIdx>().VectorSearch(x=> x.WithField(c=> c.Embedding),x=> x.ByEmbedding(embedding),numberOfCandidates:3).OfType<Category>().ToListAsync();
Another option, and one that I consider a far better one, is to not generate embeddings directly from the image. Instead, you can ask the model to describe the image as text, and then run semantic search on the image description.
var categories =await session.Query<Category>().VectorSearch(field=>{
field.WithText(c=> c.ImageDescription).UsingTask("categories-image-description");},v=> v.ByText(query),numberOfCandidates:3).ToListAsync();
We send the user’s query to RavenDB, and the AI Task categories-image-description handles how everything works under the covers.
In both cases, by the way, you are going to get a pretty magical result, as you can see in the top image of this post. You have the ability to search over the content of images and can quite easily implement features that, a very short time ago, would have been simply impossible.
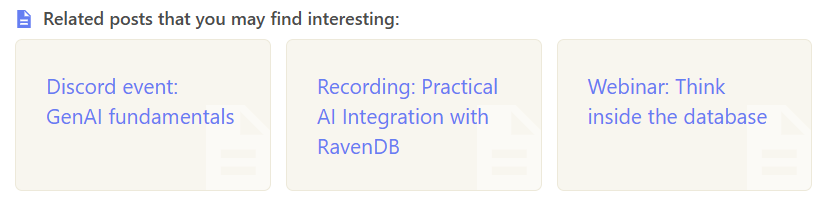
This blog recently got a nice new feature, a recommended reading section (you can find the one for this blog post at the bottom of the text). From a visual perspective, it isn’t much. Here is what it looks like for the RavenDB 7.1 release announcement:
At least, that is what it shows right now. The beauty of the feature is that this isn’t something that is just done, it is a much bigger feature than that. Let me try to explain it in detail, so you can see why I’m excited about this feature.
What you are actually seeing here is me using several different new features in RavenDB to achieve something that is really quite nice. We have an embedding generation task that automatically processes the blog posts whenever I post or update them.
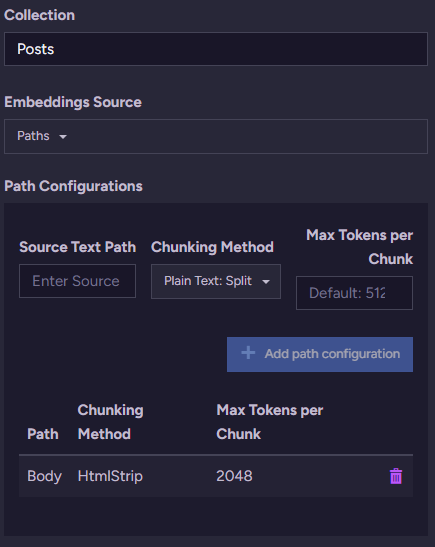
Here is what the configuration of that looks like:
We are generating embeddings for the Posts’ Body field and stripping out all the HTML, so we are left with just the content. We do that in chunks of 2K tokens each (because I have some very long blog posts).
The reason we want to generate those embeddings is that we can then run vector searches for semantic similarity. This is handled using a vector search index, defined like this:
publicclassPosts_ByVector:AbstractIndexCreationTask<Post>{publicPosts_ByVector(){
SearchEngineType = SearchEngineType.Corax;
Map = posts =>from post in posts
wherepost.PublishAt !=nullselectnew{
Vector =LoadVector("Body","posts-by-vector"),
PublishAt = post.PublishAt,};}}
This index uses the vectors generated by the previously defined embedding generation task. With this setup complete, we are now left with writing the query:
var related =RavenSession.Query<Posts_ByVector.Query,Posts_ByVector>().Where(p => p.PublishAt<DateTimeOffset.Now.AsMinutes()).VectorSearch(x => x.WithField(p => p.Vector), x => x.ForDocument(post.Id)).Take(3).Skip(1)// skip the current post, always the best match :-).Select(p => new PostReference{Id= p.Id,Title= p.Title}).ToList();
What you see here is a query that will fetch all the posts that were already published (so it won’t pick up future posts), and use vector search to match the current blog post embeddings to the embeddings of all the other posts.
In other words, we are doing a “find me all posts that are similar to this one”, but we use the embedding model’s notion of what is similar. As you can see above, even this very simple implementation gives us a really good result with almost no work.
The embedding generation task is in charge of generating the embeddings - we get automatic embedding updates whenever a post is created or updated.
The vector index will pick up any new vectors created for those posts and index them.
The query doesn’t even need to load or generate any embeddings, everything happens directly inside the database.
A new post that is relevant to old content will show up automatically in their recommendations.
Beyond just the feature itself, I want to bring your attention to the fact that we are now done. In most other systems, you’d now need to deal with chunking and handling rate limits yourself, then figure out how to deal with updates and new posts (I asked an AI model how to deal with that, and it started to write a Kafka architecture to process it, I noped out fast), handling caching to avoid repeated expensive model calls, etc.
In my eyes, beyond the actual feature itself, the beauty is in all the code that isn’t there. All of those capabilities are already in the box in RavenDB - this new feature is just that we applied them now to my blog. Hopefully, it is an interesting feature, and you should be able to see some good additional recommendations right below this text for further reading.
If you had asked me twenty years ago what is hard about building a database, I would have told you that it is how to persist and retrieve data efficiently. Then I actually built RavenDB, which is not only a database, but a distributed database, and I changed my mind.
The hardest thing about building a distributed database is the distribution aspect. RavenDB actually has two separate tiers of distribution: the cluster is managed by the Raft algorithm, and the databases can choose to use a gossip algorithm (based on vector clocks) for maximum availability or Raft for maximum consistency.
The reason distributed systems are hard to build is that they are hard to reason about, especially in the myriad of ways that they can subtly fail. Here is an example of one such problem, completely obvious in retrospect once you understand what conditions will trigger it. And it lay hidden there for literally years, with no one being the wiser.
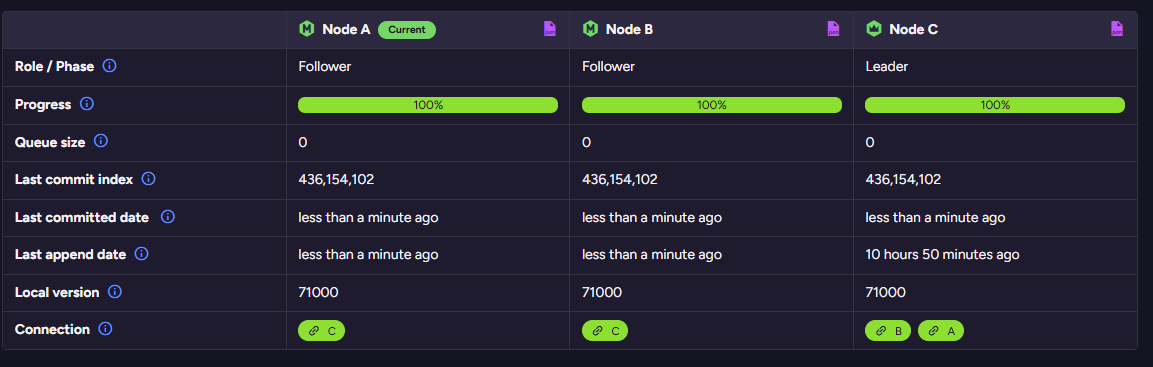
Because distributed systems are complex, distributed debugging is crazy complex. To manage that complexity, we spent a lot of time trying to make it easier to understand. Today I want to show you the Cluster Debug page.
You can see one such production system here, showing a healthy cluster at work:
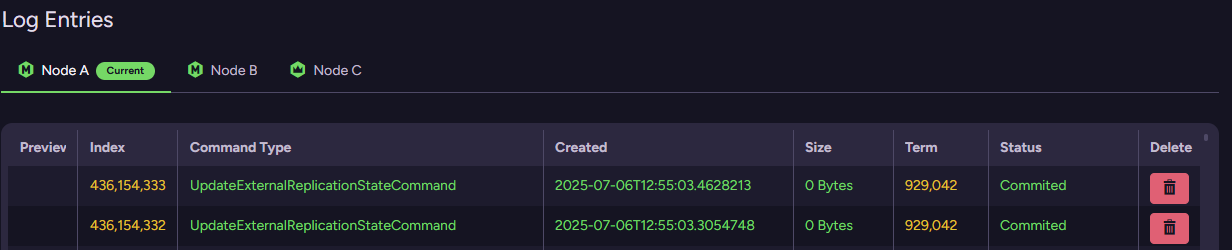
You can also inspect the actual Raft log to see what the cluster is actually doing:
This is the sort of feature that you will hopefully never have an opportunity to use, but when it is required, it can be a lifesaver to understand exactly what is going on.
Beyond debugging, it is also an amazing tool for us to explore and understand how the distributed aspects of RavenDB actually work, especially when we need to explain that to people who aren’t already familiar with it.